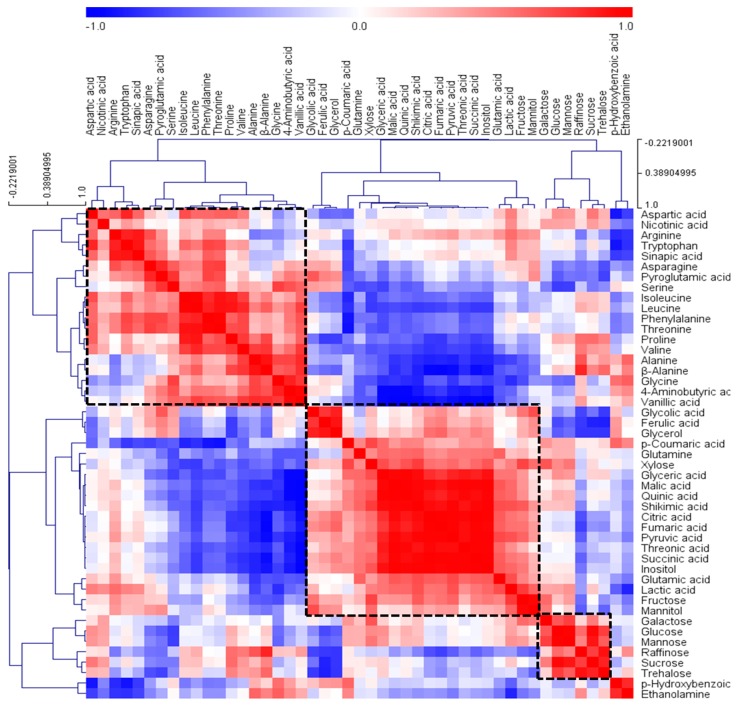
Figure 3.
Correlation matrix and cluster analysis of results obtained from data on 47 metabolites for four cultivars of L. platyphylla Wang et Tang. Each square indicates the Pearson’s correlation coefficient for a pair of compounds, and the value for the correlation coefficient is represented by the intensity of the blue or red color as indicated on the color scale. Hierarchical clusters are represented by a cluster tree.

