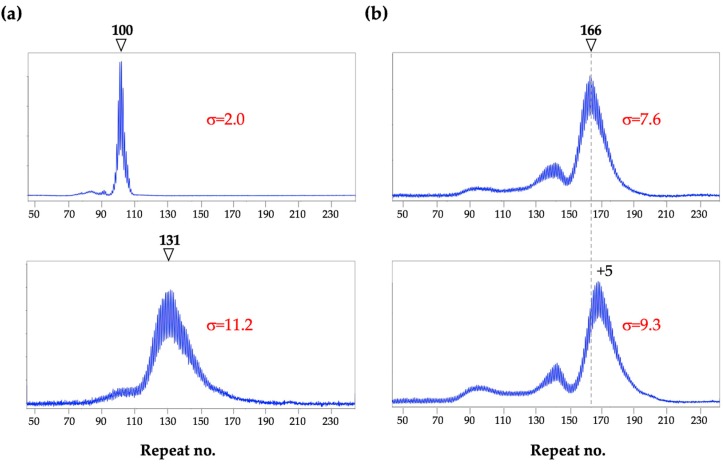
Figure 3.
Blood repeat PCR profiles for 3 human male PM carriers. Repeat PCR analysis was carried out as described previously [31]. The number associated with each arrowhead represents the number of repeats in the indicated allele. (a) Profiles of two individuals showing a unimodal profile with a sharp peak (top) and a broad peak (bottom); (b) Profiles generated from the same individual using samples taken 4 years apart. The dotted line in these panels indicates the size of the major allele at the earlier timepoint. A shift corresponding to the gain of 5 CGG repeats is seen in the later sample. In each case the σ values are for the major allele peak.

