Figure 3.
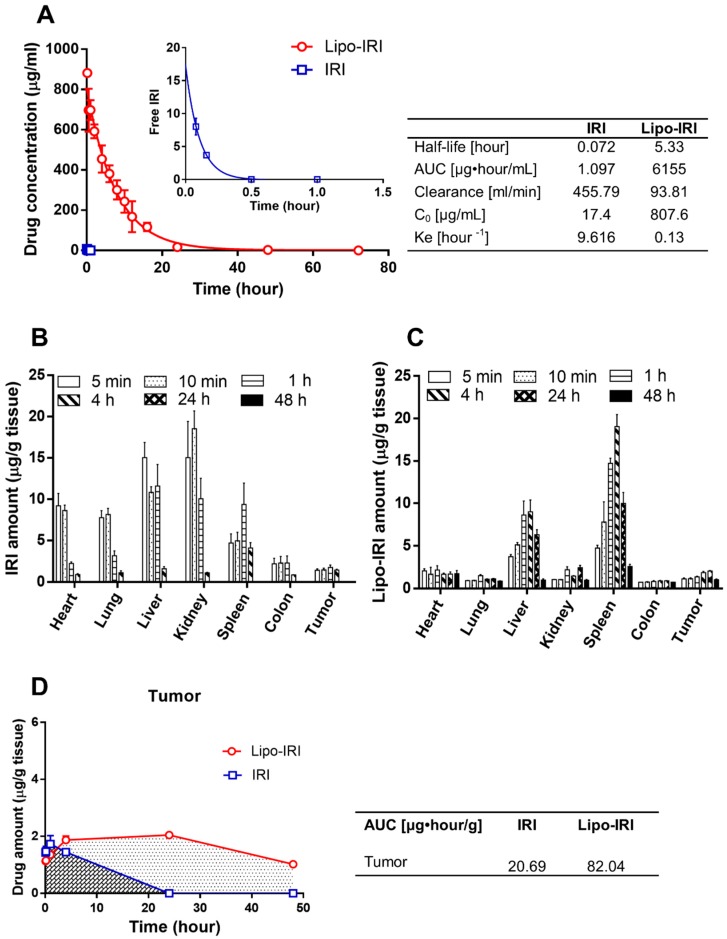
Pharmacokinetic and bio-distribution profile of Lipo-IRI and free IRI in tumor-bearing mice. Following an injection with IRI or Lipo-IRI, the blood and organs were collected at various time-points. The pharmacokinetics are shown in (A). The inset shows the profiles in the first hour after administration. The data are shown for Lipo-IRI (○) and free IRI (□). The organs were homogenized, and the amount of IRI was quantified by RP-HPLC. The bio-distribution profiles of IRI and Lipo-IRI are shown in (B) and (C). The AUC for Lipo-IRI and IRI is shown in (D). The data are represented as the mean ± SD (n = 3).

