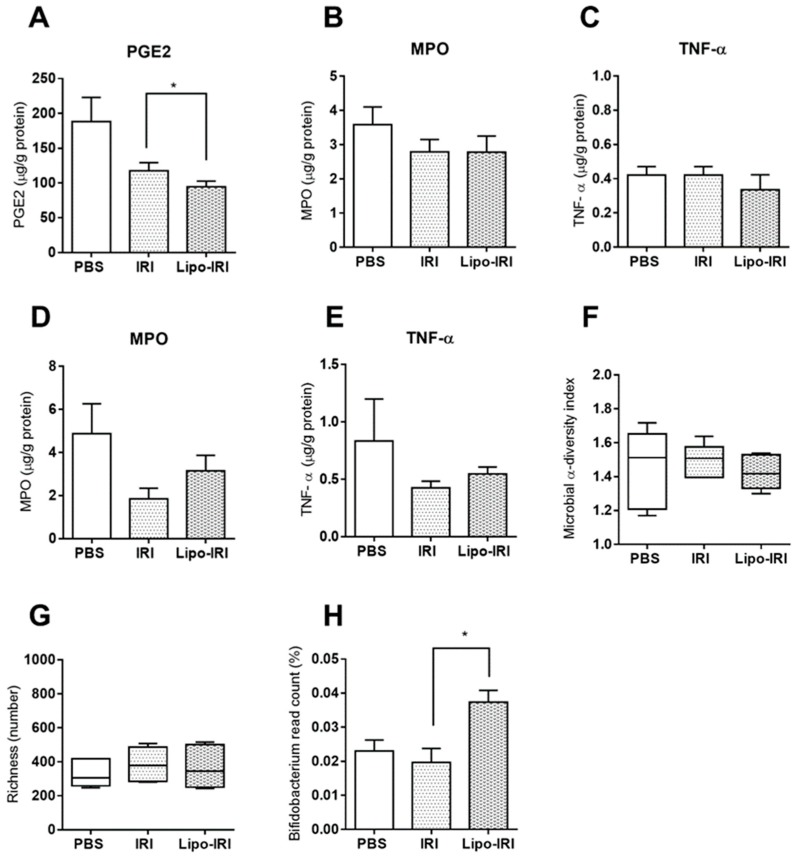
Figure 6.
Quantification of inflammatory mediators in colon tissues and microbiota analysis in fecal samples. The colon tissues were harvested after the drug treatment and homogenates were assayed with sandwich ELISA for PGE2, MPO and TNF-α (A, B and C, respectively). The MPO and TNF-α levels in the colon were assessed after four consecutive treatments (D and E). The microbiota diversity, richness, and Bifidobacterium spp. population are shown in (F), (G) and (H). Each column represents the mean ± SD (n = 3). Compared to IRI, * p < 0.05.

