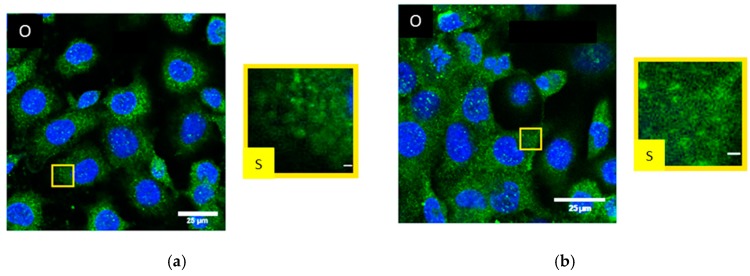
Figure 2.
CLSM images of SkBr3 breast cancer cells after (a) NRG1 treatment for 1 h; (b) trastuzumab treatment for 1 h; blue: Cell nucleus after Hoechst34580 staining; green: Cx43 specific antibody labelling and Alexa488 staining. (O) Overview with selected region. (S) Image section of a SkBr3 cell obtained. Scale bar 1 µm.

