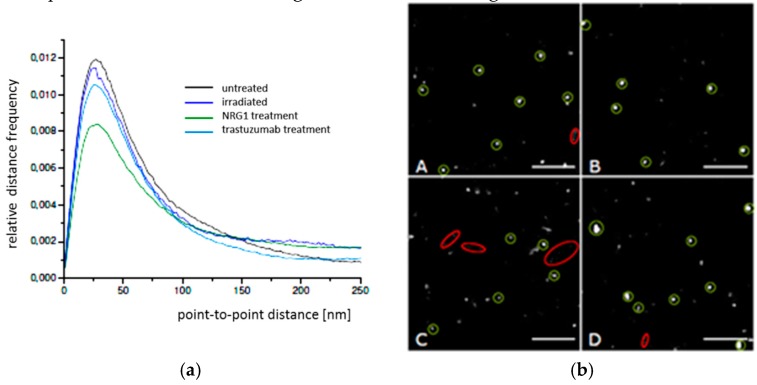
Figure 3.
(a) Relative distance frequency histograms of the point-to-point distances of fluorescently labelled Cx43 molecules in SkBr3 cells for the different treatment scenarios. The distances forming the peak correlate to connexons. (b) Pointillist images obtained from the coordinate matrices after SMLM. The clustered points (encircled in green) represent points contributing to the peak in Figure 3a. The dispersed points (encircled in red) represent points contributing to the right “tail” of the curves in Figure 3a. A = untreated; B = irradiated; C = NRG1 treatment; D = trastuzumab treatment. Scale bar 1 µm.

