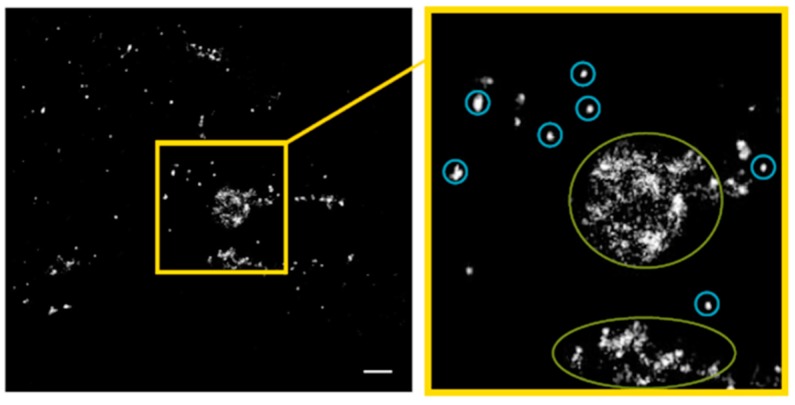
Figure 10.
Pointillist image of Cx43 molecules in the accumulation regions at the contact zones of untreated BJ cells obtained from the coordinate matrices after SMLM. The clustered points (encircled in blue) represent points contributing to the small left peak at about 29 nm in Figure 8c. The dispersed points (encircled in green) represent points contributing to the right broad peak (>400 nm) of the curve in Figure 8c. Scale bar 1 µm.

