Figure 3.
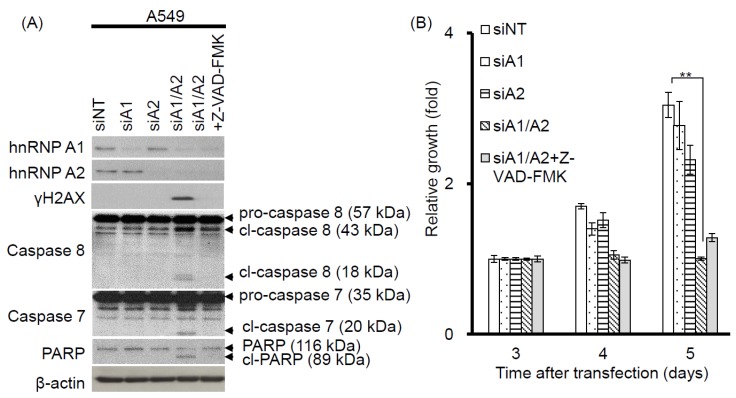
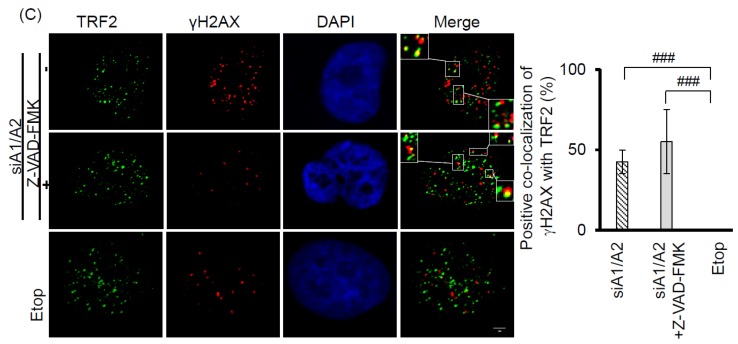
Effects of the apoptosis inhibitor Z-VAD-FMK on the induction of apoptosis, cell proliferation, and DDR. (A) A549 cells were transfected with siRNAs targeting hnRNP A1 (siA1), hnRNP A2 (siA2), both hnRNP A1 and A2 (siA1/A2), or with a non-targeting sequence (siNT) for 48 h. Cells transfected with siA1/A2 were cultured in the presence or absence of 20 mM Z-VAD-FMK for 24 h, while other transfected cells were cultured in the absence of Z-VAD-FMK for 24 h. Cell lysates were then analyzed for expression of hnRNP A1, A2, and γH2AX, as well as for the cleavage products of caspase-7 (cl-caspase-7), caspase-8 (cl-caspase-8), and PARP (cl-PARP) by western blotting. β-Actin served as a loading control; (B) Treated cells were cultured in regular medium and monitored for cell proliferation using trypan blue staining. The results shown are pooled from 2 independent experiments. ** p < 0.01, significant difference from siNT control; (C) Cells were fixed and immunostained for γH2AX (red) and TRF2 (Telomeric repeat-binding factor 2, green), and nuclei were counterstained with DAPI (blue). γH2AX foci that co-localized with TRF2 are indicated in the boxed regions. A549 cells treated with 50 μM etoposide (Etop) for 12 h served as a positive control. The percentage of nuclei showing co-localization of γH2AX with TRF2 was determined from analysis of 50 γH2AX -positive nuclei from each experiment. The results shown in the right panel are mean ± SD from 3 independent experiments. ### p < 0.001, significant difference from etoposide control. The scale bar equals 2 μm.


