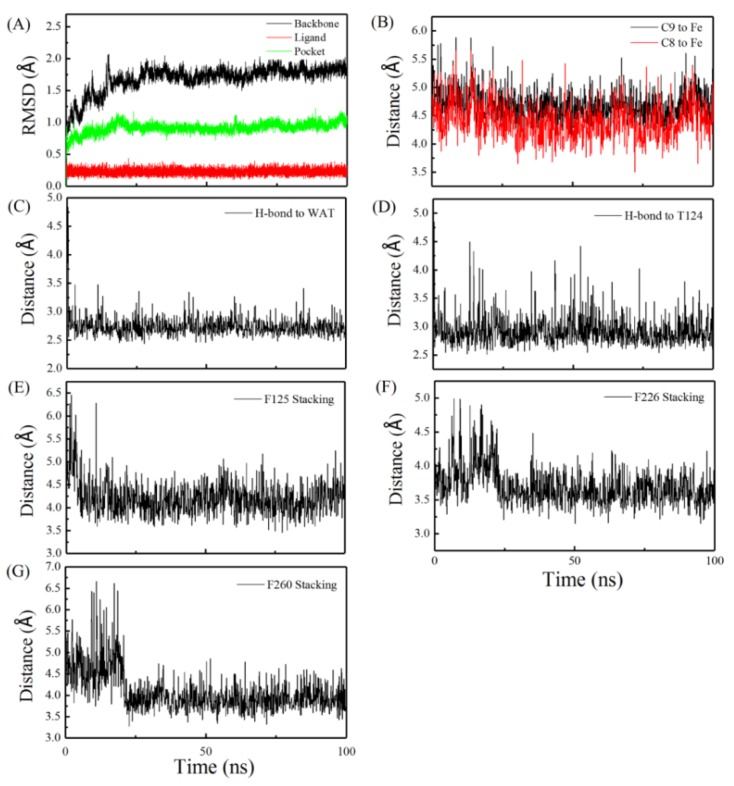
Figure 1.
Trajectory analysis for the 100 ns MD of the solvated complex system of AFB1–CYP1A2. (A) Trajectory curves of the CYP1A2 protein backbone, AFB1, and pocket. (B) Trajectory curves of the distance of C8 and C9 to Fe. (C) Trajectory curves of the distance of the hydrogen bond to water. (D) Trajectory curves of the distance of the hydrogen bond between AFB1 and Thr-124. (E) Trajectory curves of the distance of the stacking interaction between AFB1 and Phe-125, (F) Phe-226, and (G) Phe-260.

