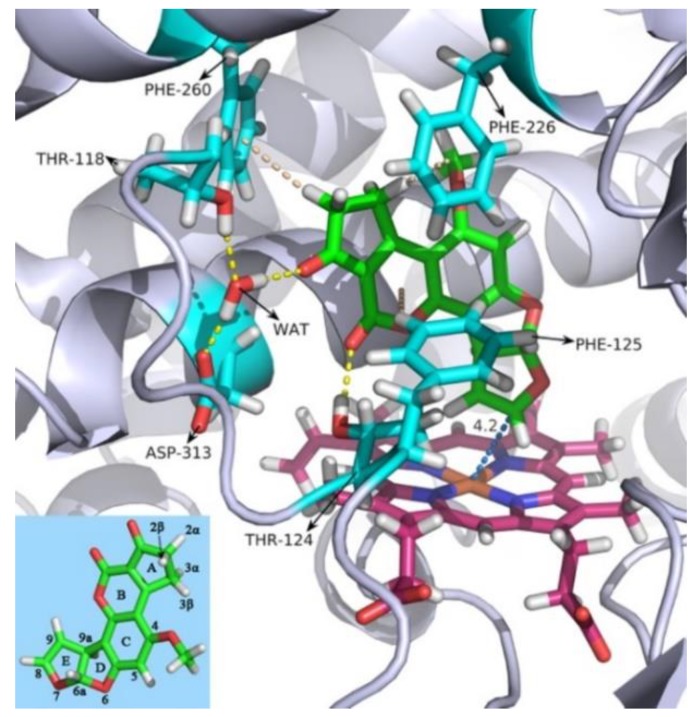
Figure 2.
The binding mode of AFB1 with human CYP1A2 from the 100 ns MD simulation. Protein backbones are represented as a blue-white ribbon, and ferriporphyrin is represented as warm pink sticks. AFB1 is represented as green sticks, and the interactive amino acid residues are represented as cyan sticks. WAT: water molecule. Color scheme: red for oxygen atoms, blue for nitrogen atoms, and white for hydrogen atoms. Hydrogen bonds are represented as yellow dashed lines, and stacking interactions between AFB1 and the residues are represented as wheat dashed lines. The distances between atoms are represented as marine dashed lines and given in angstroms. The three-dimensional structure and atom numbering of AFB1 is shown in the lower left corner. Residues 107–117 are not shown, for clarity. This figure was rendered with PyMOL [23].

