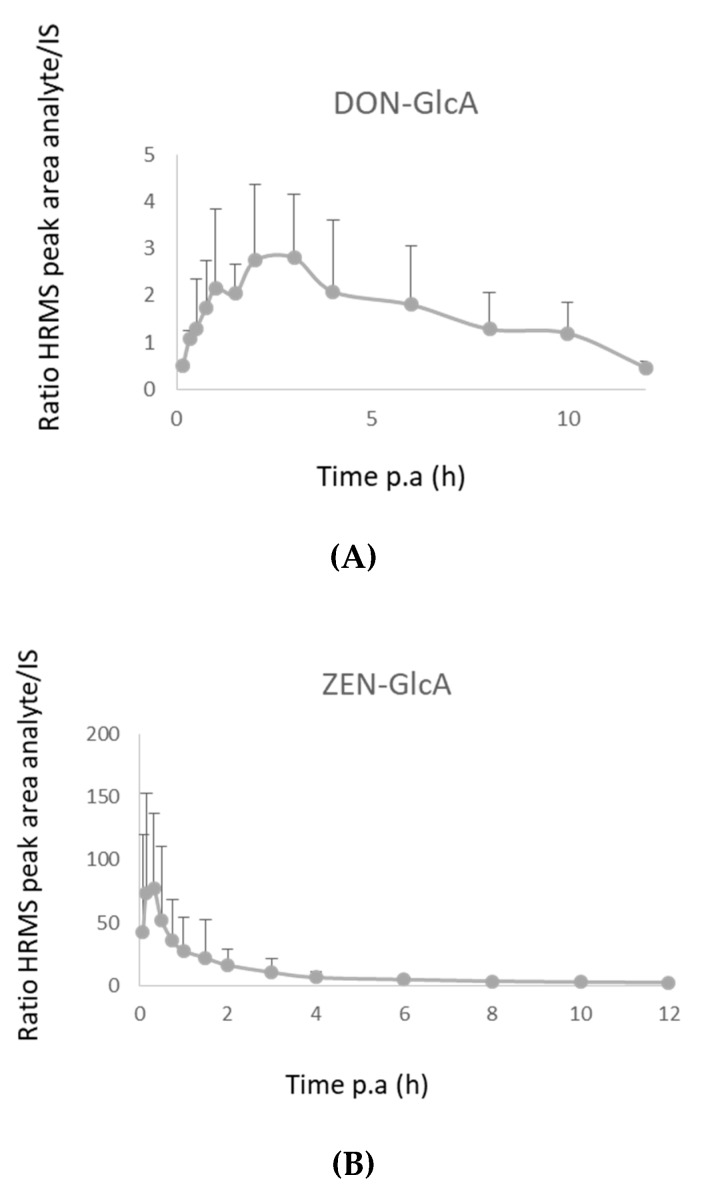
Figure 7.
(A) HRMS response–time curve of deoxynivalenol-glucuronide (DON-GlcA) in plasma after intra-gastric administration of deoxynivalenol (DON, 36 µg/kg bw) to pigs (n = 8). The mean ratio of the HRMS peak areas of DON-GlcA/13C15-DON + SD is shown. (B) HRMS response–time curve of zearalenone-glucuronide (ZEN-GlcA) in plasma after intra-gastric administration of zearalenone (ZEN, 3 mg/kg bw) to pigs (n = 8). The mean ratio of the HRMS peak areas of ZEN-GlcA/13C18-ZEN + SD is shown.

