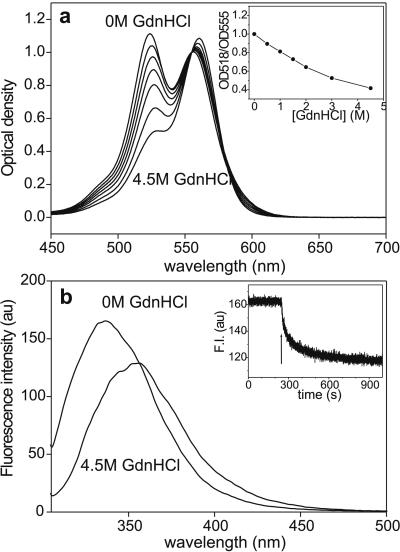
Figure 3.
(a) Absorption spectra of 5 mM aqueous rhodamine B solution as a function of GdnHCl concentration. The spectra were normalized to OD555. (a Inset) OD518/OD555 ratio, obtained from the absorption spectra of 5 mM rhodamine B, as a function of GdnHCl concentration. (b) Intrinsic tryptophan fluorescence-emission spectra of titin before (0 M GdnHCl) and after the addition of 4.5 M GdnHCl. (λex = 295 nm.) (b Inset) Kinetics of fluorescence decay coupled to titin denaturation. Buffer: 30 mM potassium phosphate, pH 7.0/0.6 M KCl. Arrow marks the addition of GdnHCl to a final concentration of 4.5 M. (λem = 340 nm.)

