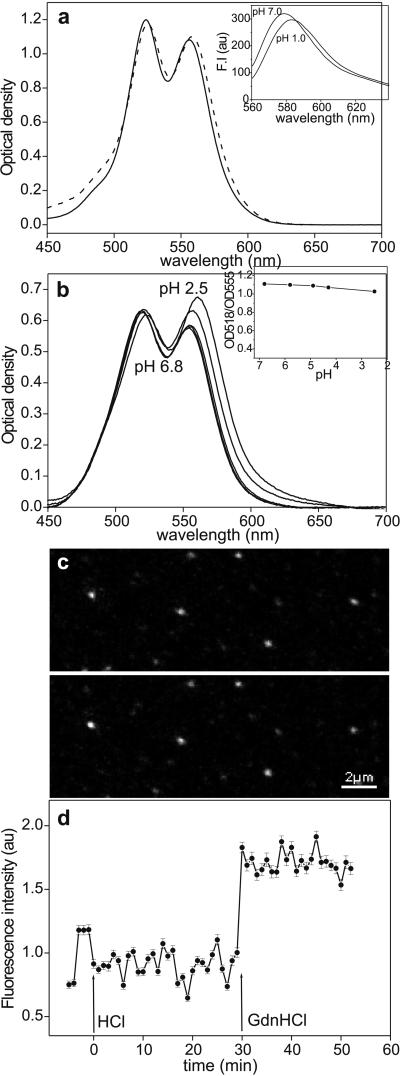
Figure 4.
(a) Effect of HCl (solid line, pH 7.7; dashed line, pH 2.0) on the absorption spectrum of 5 mM aqueous rhodamine B solution. (Inset) Fluorescence-emission spectra of 40 μM TMRIA solution at pH 7.0 and 1.0. (λex = 550 nm.) (b) Absorption spectrum of TMRIA-labeled titin as a function of pH. (b Inset) OD518/OD555 ratio, obtained from the absorption spectra of TMRIA-labeled titin, as a function of pH. (c) Confocal microscopic image of surface-adsorbed, fluorescently labeled titin molecules before (pH 7.7, Upper) and after (Lower) the addition of a pH 2.0 buffer solution. (d) Mean fluorescence intensity obtained for an ensemble of surface-adsorbed titin molecules as a function of time after acidic denaturation (at HCl, pH 2.0) and the addition of 5.5 M GdnHCl (at GdnHCl). The pH of the GdnHCl solution was 7.7. Data points represent mean ± SEM for an average of 187 molecules per field of view. Data were normalized to the average of the first five points that represent control settings.

