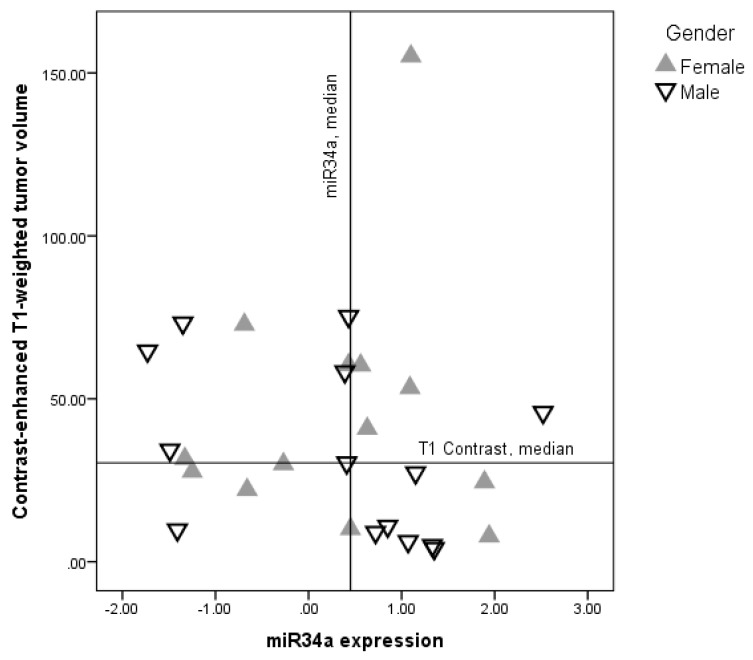
Figure 1.
Relationship between miR-34a expression and contrast-enhanced T1-weighted glioblastoma tumor volume. Solid lines represent median values of either miR-34a expression (vertical) or T1 contrast median (horizontal). Gender dependent correlation between T1-weighted contrast-enhanced tumor volume and miR-34a expression was found in the male ▽ (Spearman rho = −0.53, p = 0.05) but not in the female ▲ (Spearman rho = −0.09, p = 0.78) subgroup.

