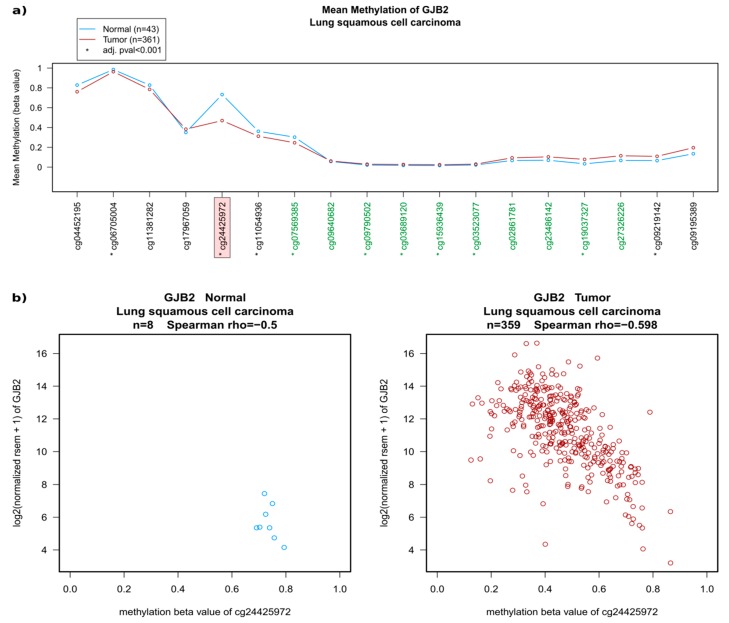
Figure 3.
Example of the methylation status of Cx26 (GJB2) in LUSC. (a) A 450k Methylation Array displaying individual probes along the gene region is shown (equally distributed). Probes in green are part of the CpG cluster of this gene. Significant differences are highlighted with an asterisk on individual probes. Probe cg24425972 (highlighted by the pink box) shows the most significant demethylation in LUSC compared with healthy tissue. (b) The methylation status of probe cg24425972 is clearly reduced in most tumour samples (red, right side) compared with healthy tissue (blue, on the left) and this correlates well with the observed increased gene expression in the samples that have reduced methylation (RSEM from Illumina HiSeq RNA-seq).

