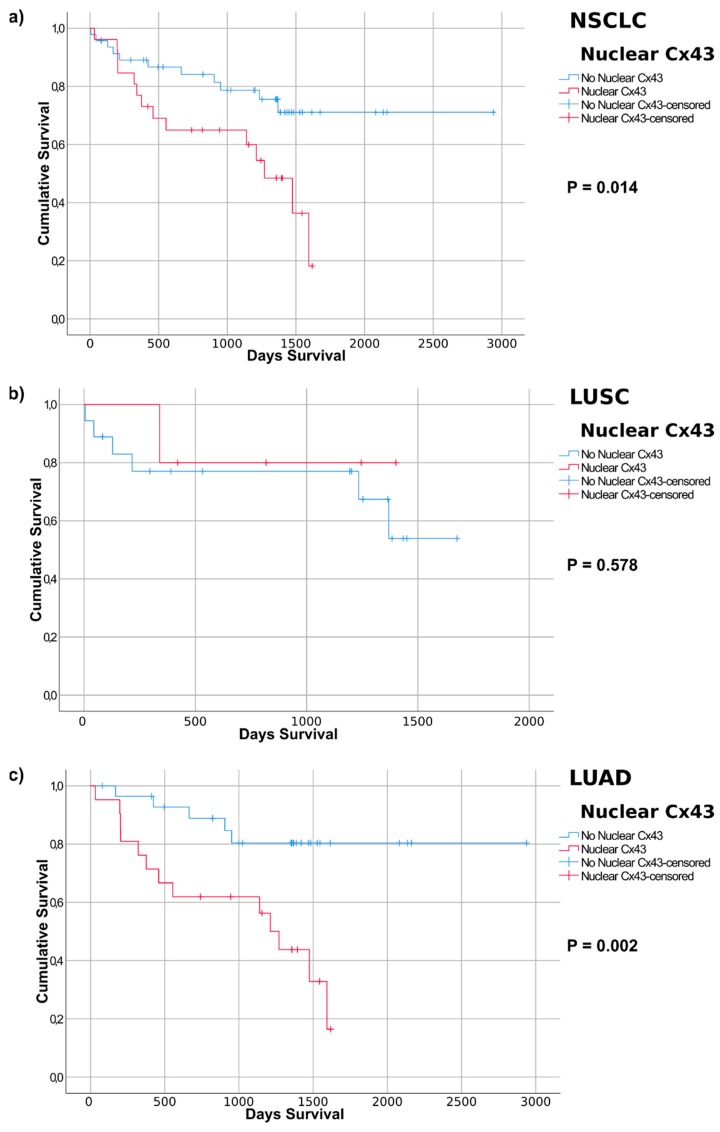
Figure 6.
Kaplan-Meier curves based on nuclear Cx43 expression detected by immunohistochemistry of lung cancer samples. Tumours with significant nuclear Cx43 expression (over 5% of total tumours) are depicted in red and compared with the rest of the tumour samples (in blue). p-values refer to the log-rank test (Mantel-Cox analysis). Average survival times of the patient cohorts are listed. (a) NSCLC (non-small cell lung cancer, refers to the merged LUAD and LUSC groups); (b) LUSC (lung squamous cell carcinoma); (c) LUAD (lung adenocarcinoma).

