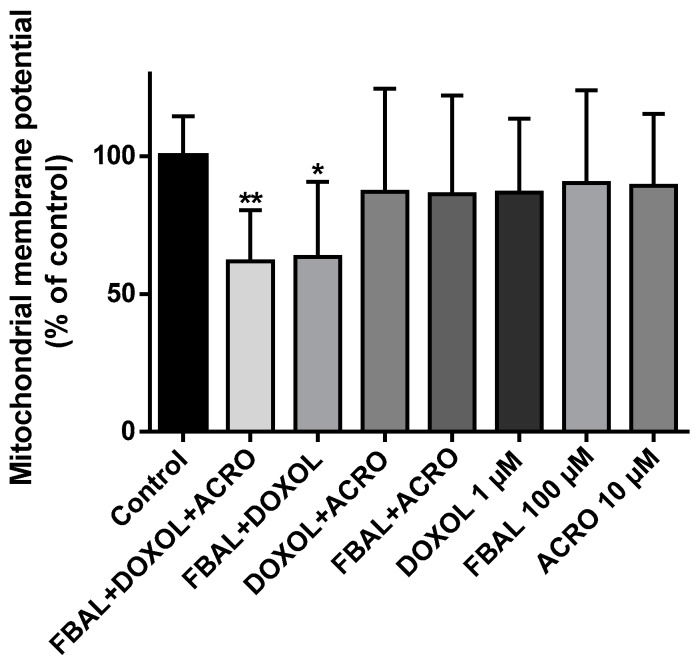
Figure 10.
Mitochondrial membrane potential evaluation using the JC-1 dye in differentiated H9c2 cells exposed to metabolites (FBAL 100 μM, DOXOL 1 μM, ACRO 10 μM) or their combination for 48 h. Results are presented as mean ± SD of five independent experiments (total of 14–15 wells). Statistical analyses were performed using the Kruskal–Wallis test, followed by the Dunn´s post hoc test (* p < 0.05, ** p < 0.01 vs. control).

