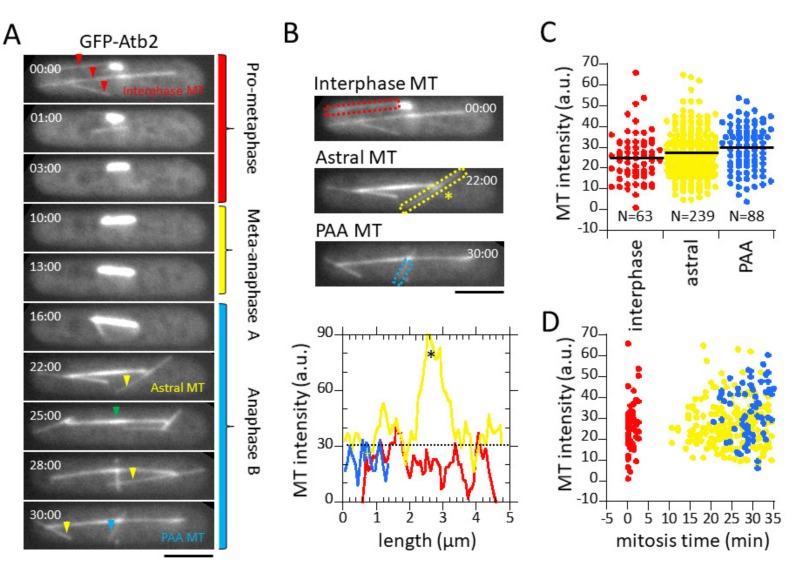
Figure 2.
MT fluorescent intensity converts to MT number. (A) Shown is a time-lapse summation montage of a wild-type mitotic fission yeast cell expressing GFP-Atb2. Different microtubule structures emerged at different phases of the cell cycle. Interphase MTs (red arrow) begin to depolymerize at the start of mitosis. Prop-metaphase corresponds to the initial spindle formation where the spindle elongates to about ~3 µm long. Metaphase-anaphase A is where spindle length remains relatively unchanged. Anaphase B is where the spindle elongates to ~12 µm long then undergoes a breakdown. Early anaphase B marks the emergence of the astral MTs (yellow arrow) and late anaphase B marks the emergence of the PAA MTs (blue arrow). A clear central spindle region, or midzone, is evident during anaphase (green arrow). Note that while the spindle intensity changes throughout mitosis, the intensities of the interphase, astral, and PAA MTs remains relatively the same during the 30 min of imaging. Bar, 5 µm. (B) Plot showing line scans of the interphase, astral, and PAA MT bundles from the cell in Figure 2A. Note that the signal varies for each class of MTs, but all MTs have similar signal intensities. The asterisk * denotes the antiparallel MT overlap of the astral MT bundle. This overlap has 3× higher intensity compared to the distal MT regions. (C) Dot plot of fluorescence intensities of interphase, astral, and PAA microtubules. The three different MT structures have similar mean intensities of ~30 a.u. (D) Dot plot of fluorescence intensities of interphase, astral, and PAA microtubules versus mitosis time. The three different MT structures have similar mean intensity over the entire imaging period.

