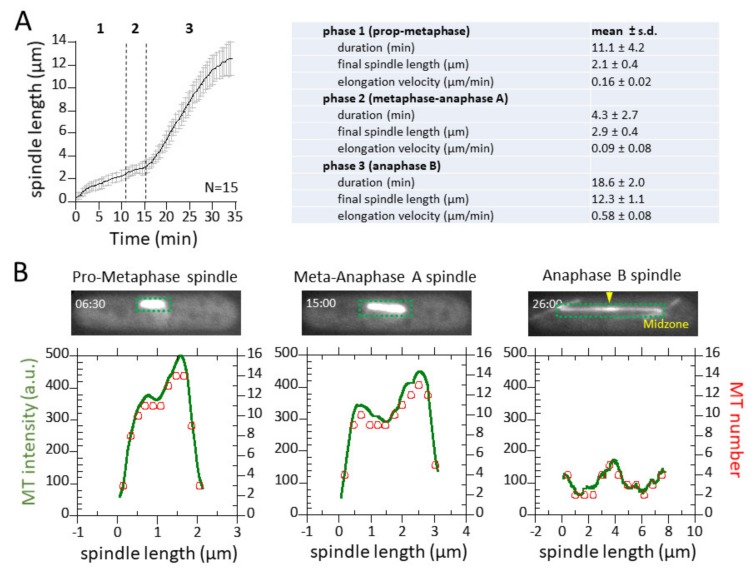
Figure 3.
Spindle dynamics and corresponding MT intensity and number. (A) Plot of spindle length versus time. Shown are mean length ± s.d. for 15 wild-type fission yeast cells. Summary table of spindle dynamics for 15 wild-type fission yeast cells. (B) Representative plots of spindle fluorescence intensities for three different time points or spindle lengths (green). The intensities are converted to MT number (red) by dividing the total intensity over the mean intensity of one MT.

