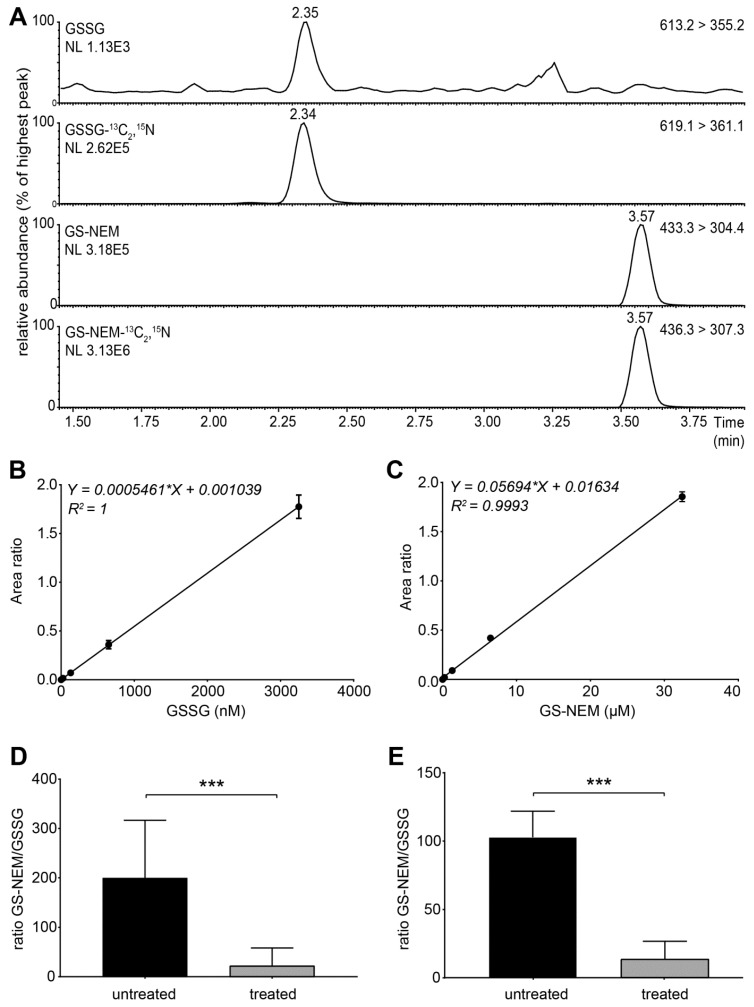
Figure 2.
Method validation. (A) Representative extracted ion chromatograms of glutathione in an oxidised form (GSSG), GS-NEM and their isotopically labelled internal standards from control cells prepared using the presented sample preparation and UPLC-MS/MS method are shown. Mass transitions and the signal intensity (NL) are indicated for each analyte. (B,C) Calibration curves were generated using serially diluted amounts of unlabelled analyte for (C) GSSG (0–3.25 µM), and (D) GSH-NEM (0–32.41 µM), and a constant amount of corresponding isotopically labelled internal standard. Each data point represents the mean area ratio ± standard deviation duplicated measurements. Invisible error bars fall within the symbol size. Linearity was determined by linear regression, and the coefficient of determination (R2) was used as a goodness of fit. (D,E) GS-NEM/GSSG ratio in cells incubated with (D) 25 µM menadione for 1 h or (E) 12.5 µM BSO for 24 h, or vehicle. Data present the GSH/GSSG ratio. Additional plots of analytes are presented in Figure S1. Data are shown as bar plots with standard error. Mann–Whitney U test was performed to determine significant differences between the groups (*** p-value < 0.001).

