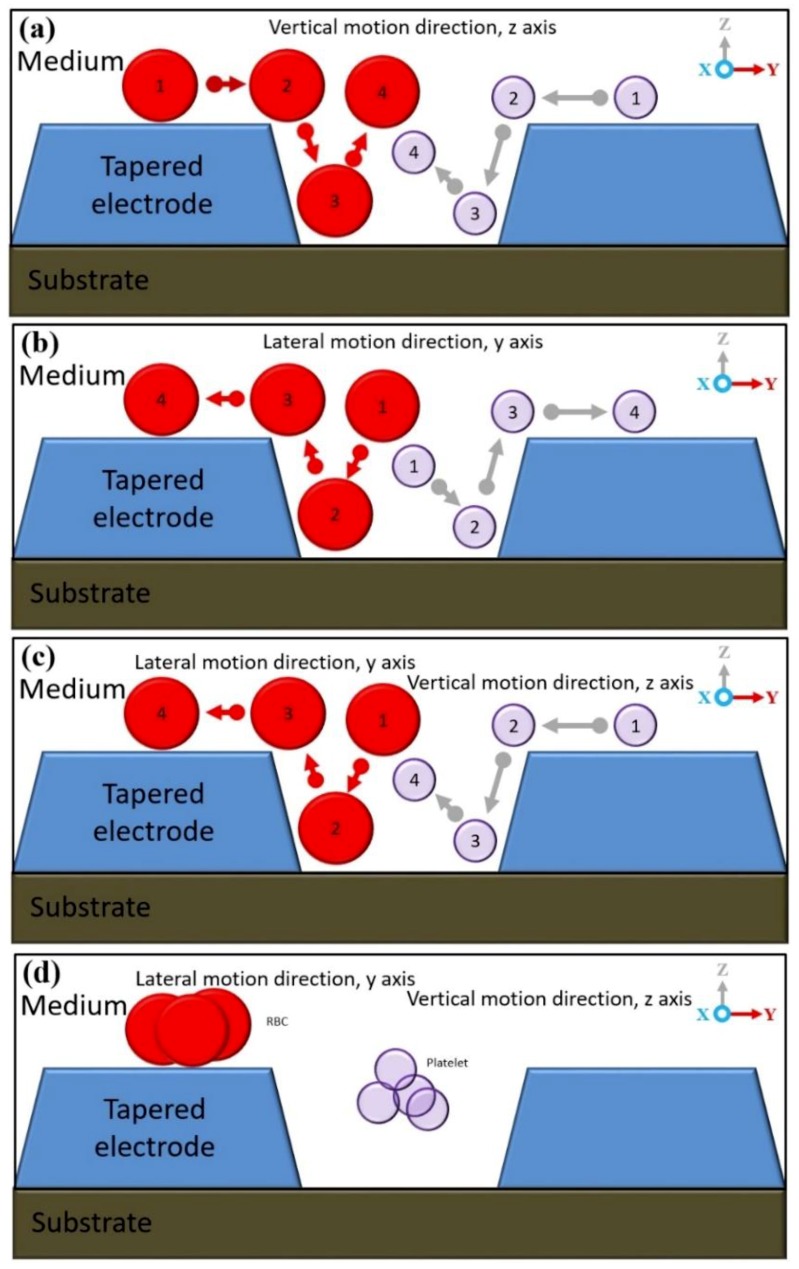
Figure 13.
The separation of RBC and platelets: (a) Sequencing of the separation at the low input frequency region where both RBC and platelets were exposed to NDEP vertical repulsion at the z-axis; (b) at the high input frequency region where RBC and platelets were exposed to PDEP lateral attraction at y-axis; (c) within the fxo input frequency region where fadj produced different polarisations between the RBC and platelets, PDEP lateral attraction at the y-axis and NDEP vertical repulsion at the z-axis, respectively; and (d) separation at two different locations, which are RBC at the top surface microelectrodes and platelets between two microelectrodes.

