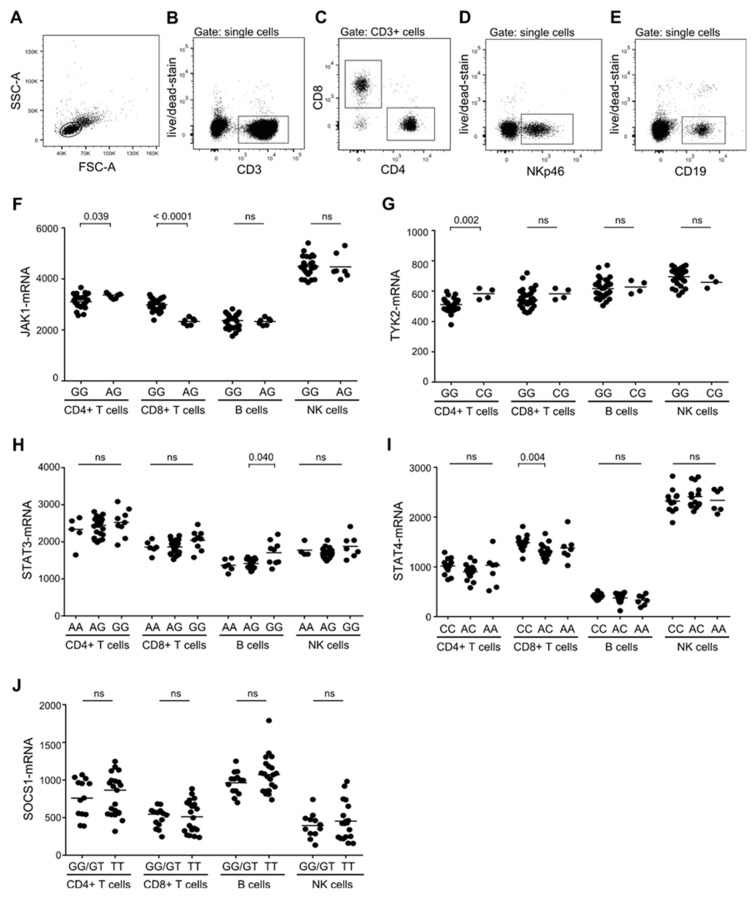
Figure 1.
Multiple sclerosis (MS)-risk alleles and expression level of STAT-pathway molecules. (A–E) Gating strategy to identify T, B, and NK cells include a lymphocyte gate in a FSC-A/SSC-A dot plot (A), and a doublet cell exclusion in a FSC-A/FSC-H dot plot. T cells were then defined as CD3+ cells (B) and subdivided into CD4+ and CD8+ T cells (C). NK cells were defined as CD3- NKp46+ cells (D) and B cells as CD3- CD19+ cells (E). (F–J) mRNA level of JAK1 in donors homozygous (GG) or heterozygous (AG) for the JAK1 MS-risk allele rs729222 (F), of TYK2 in donors homozygous (GG) or heterozygous (CG) for the TYK2 MS-risk allele rs34536443 (G), of STAT3 in donors homozygous (AA), heterozygous (AG), or negative (GG) for the STAT3 MS-risk allele rs1026916 (H), of STAT4 in donors homozygous (CC), heterozygous (AC) or negative (AA) for the STAT4 MS-risk allele rs6738544 (I), and of SOCS1 in donors homozygous/heterozygous (GG/GT) or negative (TT) for the SOCS1 MS-risk allele rs12596260 (J) in resting CD4+ T cells, CD8+ T cells, B cells and NK cells. The median value is shown for all groups analyzed.

