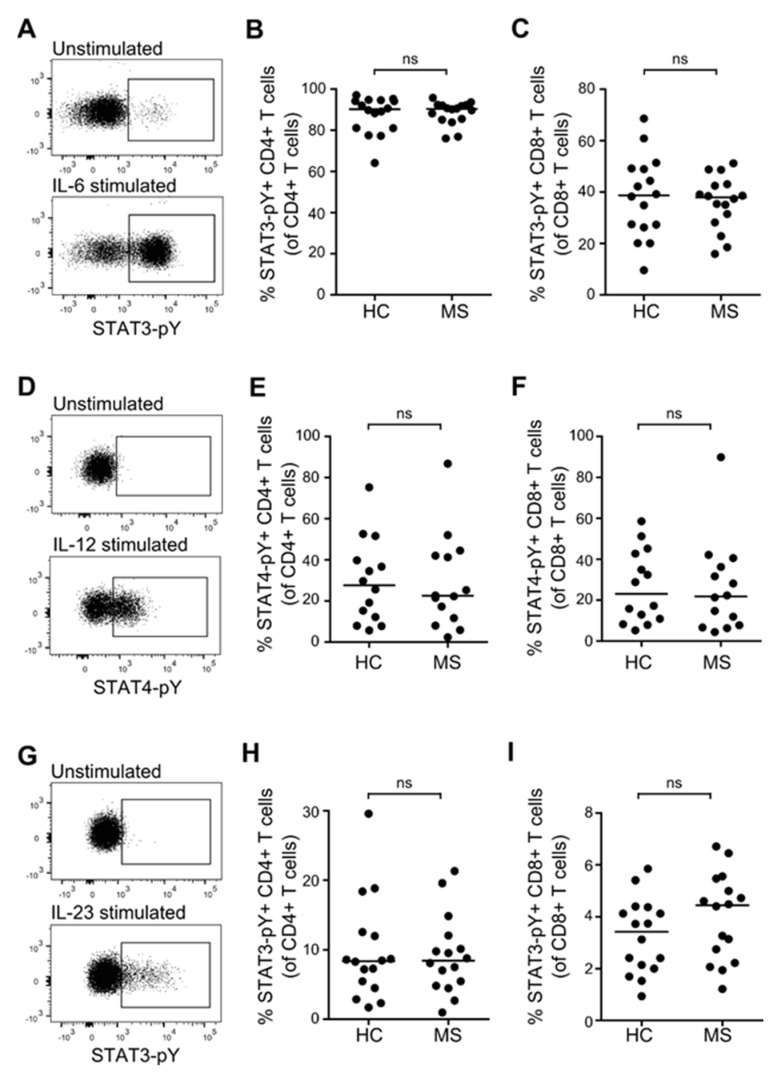
Figure 5.
IL-6-, IL-12-, and IL-23-induced STAT activation in primed T cells. (A) Dot plot example of IL-6-induced STAT3-pY in primed T cells; isotype control is shown in the upper panel. (B,C) Frequency of IL-6-induced STAT3-pY+ CD4+ T cells (B) and CD8+ T cells (C) in healthy controls (HC) and patients with RRMS. (D) Dot plot example of IL-12-induced STAT4-pY in primed T cells; isotype control is shown in the upper panel. (E,F) Frequency of IL-12-induced STAT4-pY+ CD4+ T cells (E) and CD8+ T cells (F) in healthy controls and patients with RRMS. (G) Dot plot example of IL-23-induced STAT3-pY+ in primed T cells; isotype control is shown in the upper panel. (H-I) Frequency of IL-23-induced STAT3-pY+ CD4+ T cells (H) and CD8+ T cells (I) in healthy controls and patients with RRMS. The median value is shown for all groups analyzed.

