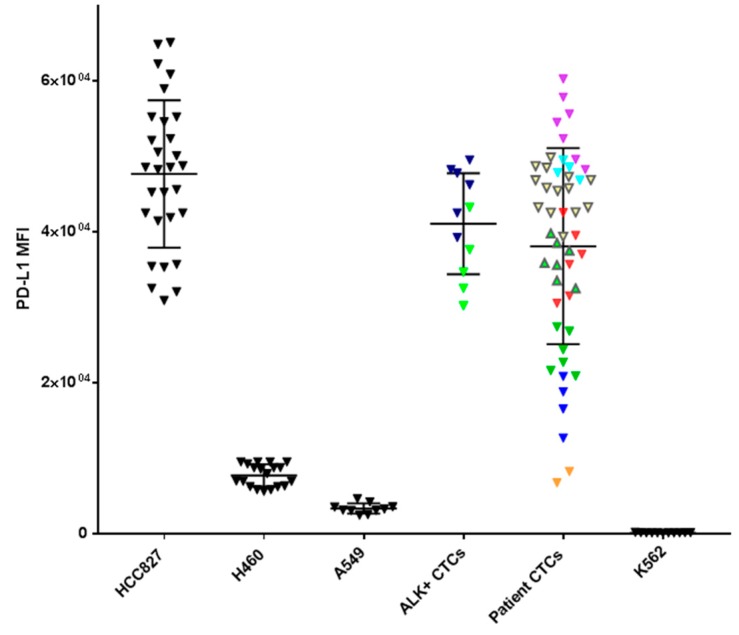
Figure 5.
Programmed death ligand-1 (PD-L1) status measured by mean fluorescence Intensity (MFI) of NSCLC cell lines (HCC827, H460, A549), patient CTC samples (each colour representing a different patient sample and the individual data point CTC PD-L1 expression), ALK+ CTCs and K562 (negative control). The individual colours represent individual CTCs within the same sample.

