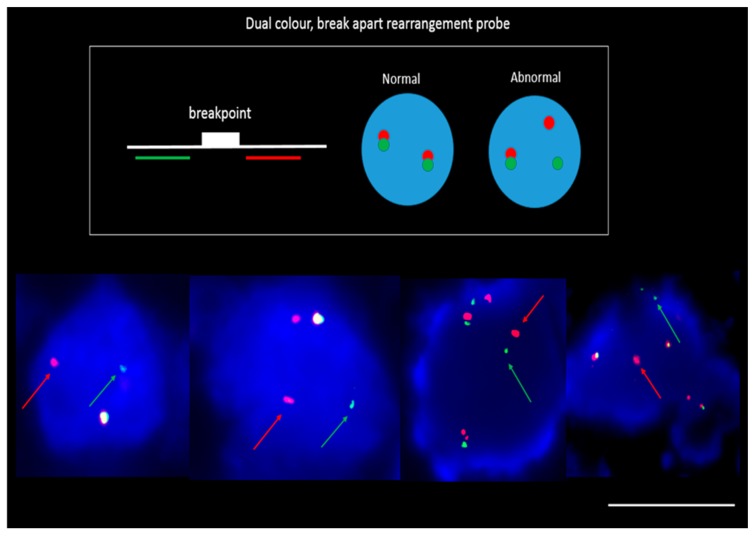
Figure 6.
Molecular fluorescence in-situ hybridization (FISH) analysis on enriched CTCs with NSCLC. Cells were stained using Vysis Break Apart FISH probe and counterstained with DAPI. The red and green signals demonstrate a separation of the original fusion signal (arrows), indicating a rearrangement in the 2p23 ALK-gene locus. Scale bar represents 10 µm.

