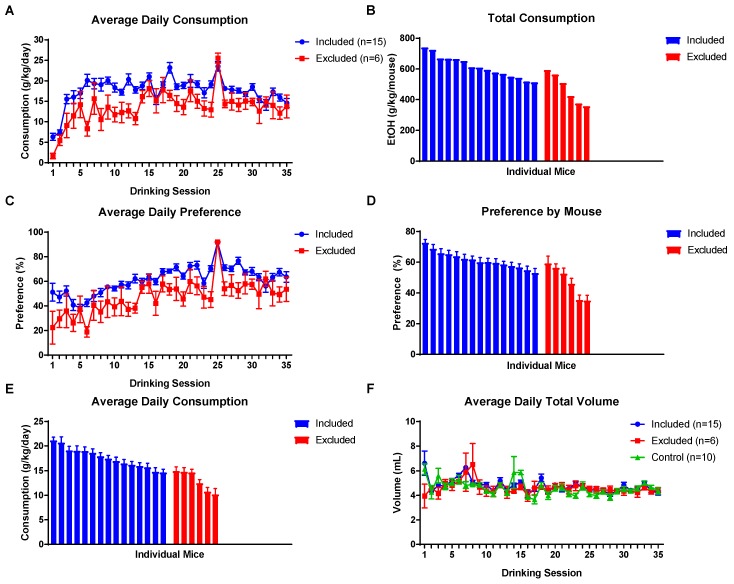
Figure 2.
EOD 2BC drinking results of sires. (A) Average EtOH consumption per drinking session of those animals that were selected for breeding (included) and those that were not used for breeding (excluded). (B) Cumulative EtOH consumption for the ~3 months exposure period for individual mice in the included and excluded groups. (C) Average EtOH preference per session by group. (D) EtOH preference of individual mice in the included and excluded groups. (E) Individual average daily EtOH consumption for the ~3 months exposure period observed for individual mice in the included and excluded groups. (F) The average total volume of fluid ingested per session by mice did not differ between groups. Data presented as mean ± SEM. (Some error bars in (A,C,F) are obscured by data points.).

