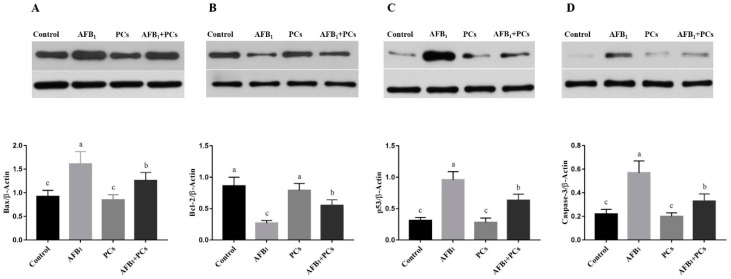
Figure 6.
Effect of PCs on protein expression levels of mitochondrial apoptosis-associated genes in the control and experimental broilers. All data were expressed as mean ± SD. Columns with different letters (a–c) indicate a significant difference at (p < 0.05). The lower bands are representing β-Actin for all above validated proteins. (A) Bcl-2-associated X protein (Bax); (B) B-cell lymphoma 2 (Bcl-2); (C) tumor protein p53 (p53); and (D) caspase-3.

