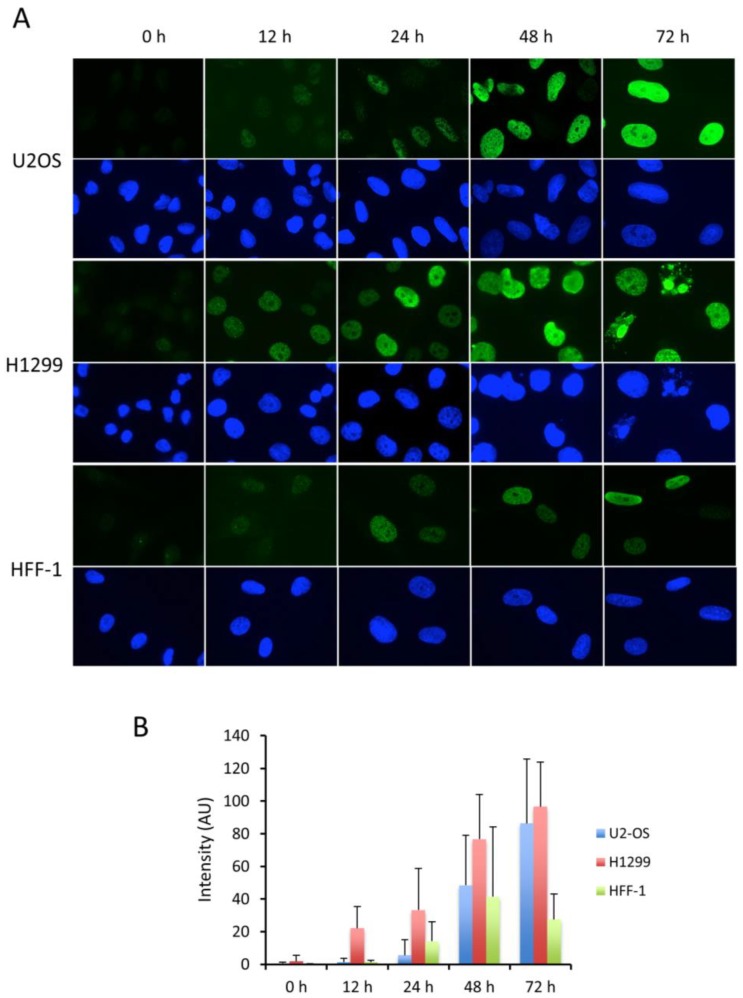
Figure 2.
Dynamics of γ-H2AX pattern formation in U2OS, H1299 and HFF-1. The cells shown in (A) were treated with HU as in Figure 1. The accumulation of γ-H2AX overtime was revealed with mAb 3F4 either by immunofluorescence microscopy (A) or by measuring the fluorescence intensity of a minimum of 150 nuclei per condition recorded from three different experiments (B). The pictures shown in (A) correspond to typical fields of the observed cells. Magnification: 630×. In (B) are represented the average values of the measured nuclear fluorescence intensities after subtraction of the background mean values recorded at 0 h.

