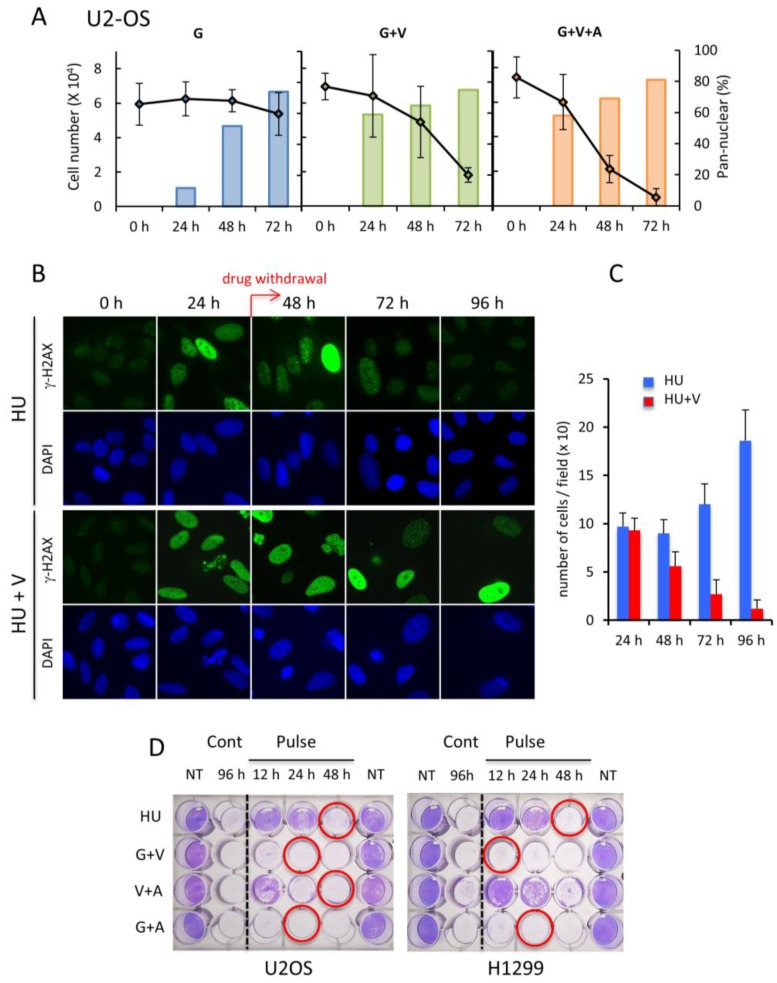
Figure 6.
Cell death induction upon formation of widespread pan-nuclear γ-H2AX. (A) Time course analysis of the percentage of pan-nuclear γ-H2AX-stained U2OS cells after treatment with G, G+V, or G+V+A. The graphs correspond to the number of cells that were bound to the support in parallel experiments. A minimum of 150 cells were analyzed in each case. (B) U2OS cells were incubated with either HU or HU+V. Twenty-four hours post-treatment, the drugs were removed by replacing the culture medium with fresh medium (pulse treatment). The pictures show the γ-H2AX levels of representative nuclei monitored by immunofluorescence before (0 h) or after the treatment (24 h) or after 1 (48 h), 2 (72 h), or 3 (96 h) days of drug withdrawal. Magnification: 630×. The calculated number of cells remaining attached to the coverslips under these conditions is represented in (C). (D) Viability assays of pulse-treated U2OS or H1299 cells. Equal numbers of seeded cells were either continuously (Cont) or pulse- (Pulse) treated with the indicated drug mixtures. 96 h post-incubation, the cells were fixed and stained with crystal violet (Materials and Methods). The red circles correspond to the time of treatment which triggers in each condition mainly widespread pan-nuclear γ-H2AX staining as shown in Figure 4. NT, nontreated.

