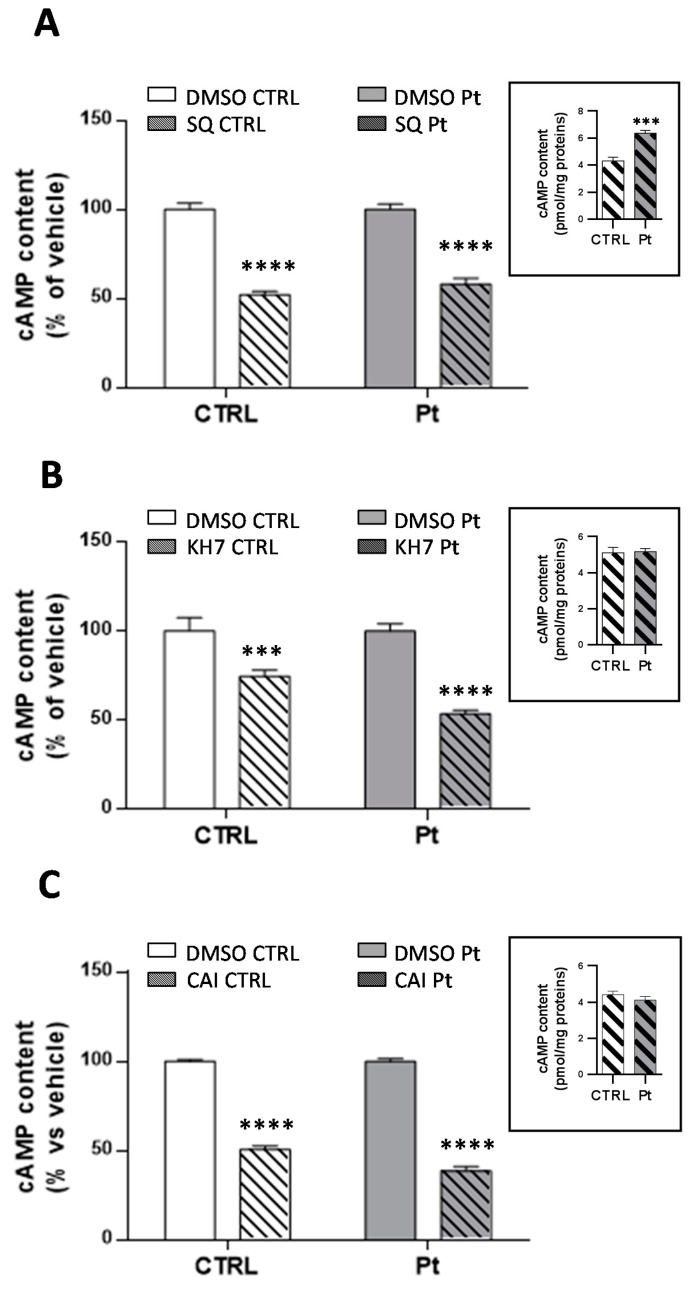
Figure 3.
The contribution of tmAC and sAC to the cAMP cellular levels. cAMP content in the CTRL (open bar) and Pt (grey bar) fibroblasts incubated with SQ22386 (A), KH7 (B) and CAI (C). Data, expressed as a percentage of the DMSO values, are means ± SEM from three to 14 independent experiments under each condition. The significance was calculated with one-way ANOVA with a Bonferroni post hoc test; **** p ˂ 0.0001 vs. vehicle-treated cells. See Materials and Methods for experimental details. The bar graphs in the inset of (A–C) display the absolute values of the cAMP content after drug treatment, expressed as pmol/mg protein. Values are means ± SEM from three to 14 independent experiments; the significance was calculated with the Student’s t test. *** p ˂ 0.0005, **** p ˂ 0.0001 vs. CTRL-treated cells.

