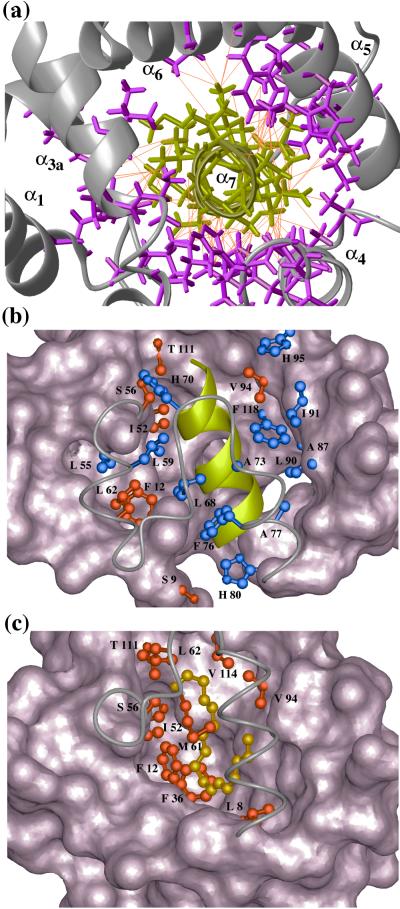
Figure 4.
Close-up views of the pheromone-binding site in a BmPBP–bombykol complex (14) and the corresponding molecular region of unliganded BmPBPA. (a) NOE network in the potential ligand-binding region in BmPBPA, viewed in the direction of the axis of the helix α7 (same viewing angle as in Fig. 1b). In total, 125 upper-distance limits between residues of α7 and the rest of the protein (shown in orange) define the position of α7 in the core of BmPBPA. α7 is shown in yellow, side chains from the remainder of the protein are magenta, and the backbone is gray. (b) View of the hydrophobic core of BmPBPA in a direction perpendicular to the axis of helix α7. The bottom of the cavity, with this viewing angle, is drawn as a space-filling surface. The cover of the cavity formed by residues 56–79 is drawn by a gray line representing the polypeptide backbone. The C-terminal helix α7 is represented by a yellow ribbon. Side chains that have heavy atoms within a distance of 4.0 Å to any atom in helix α7 are drawn as ball-and-stick models. Among these, the side chains that also show contacts to bombykol in the crystal structure of the BmPBP–bombykol complex are highlighted in red, whereas the other drawn side chains are blue. (c) Similar presentation as b of the crystal structure of the BmPBP–bombykol complex. The side chains that have heavy atoms closer than 4.0 Å to any pheromone atom are drawn in red (Ser-9 is not visible). The pheromone is drawn as a gold-colored ball-and-stick-model. Comparison of b and c shows particularly clearly that the position of the helix α7 in BmPBPA corresponds to the location of the pheromone in the structure of the BmPBP–bombykol complex described by Sandler et al. (14).

