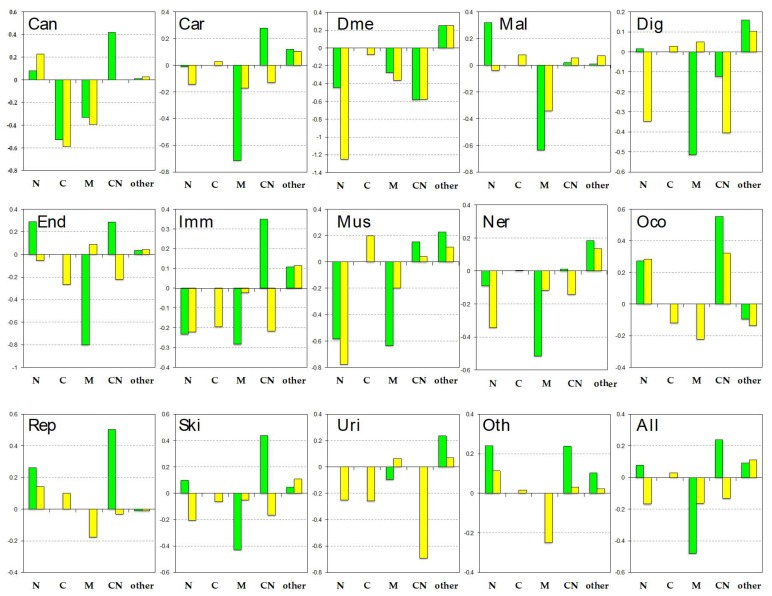
Figure 4.
Subcellular localizations by disease category. The bars represent the degree of over-representation in each of the location categories, where green represents pProS-containing proteins, and yellow represents non-pProS proteins (see also Materials and Methods). N: Nuclear; C: Cytoplasm; M: Membrane; CN: Cytoplasm and nuclear; Can: Cancers; Car: Cardiovascular diseases; Dme: Congenital disorders of metabolism; Mal: Congenital malformations; Dig: Digestive system diseases; End: Endocrine and metabolic diseases; Imm: Immune system diseases; Mus: Musculoskeletal diseases; Ner: Nervous system diseases; Oco: Other congenital disorders; Rep: Reproductive system diseases; Ski: Skin diseases; Uri: Urinary system diseases; Oth: Other diseases; All: All disease-related proteins.

