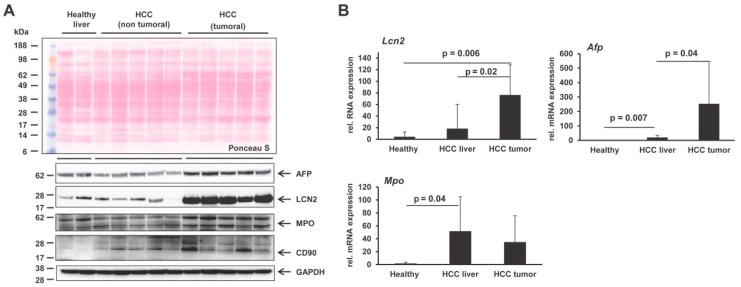
Figure 9.
Differential expression of LCN2, AFP, MPO and CD90 in HCC mouse livers. (A) Western blots were performed to detect LCN2, AFP, MPO and CD90 in liver protein extracts from healthy mice (n = 3) and mice with HCC on tumoral and non-tumoral liver extracts (n = 8 animals/group). GAPDH was used as a loading control. The antibodies used are listed in Table 1. (B) Quantitative real-time PCR analysis of Lcn2, Afp and Mpo mRNA levels in healthy mice (n = 4), non-tumoral liver (n = 8), and tumoral liver extracts of HCC mice (n = 8). The quantity of mRNA in healthy mouse liver was set to 1, and expression levels in the HCC groups were expressed as relative values. All measurements were normalized to β-Actin expression. Primers are listed in Table 2. Statistical analysis was performed by the Student t-test and standard deviations below 0.05 were considered significant.

