Figure 7.
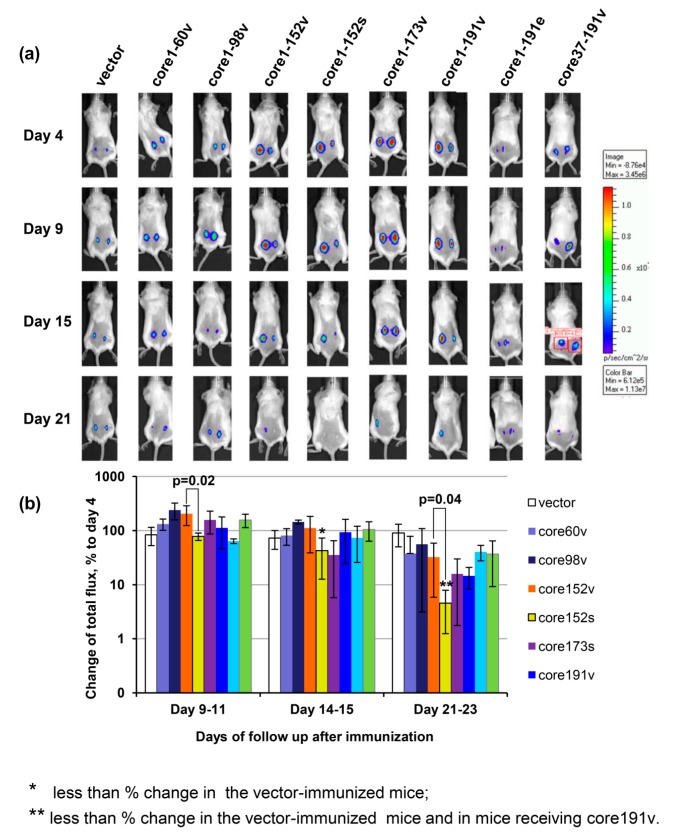
The effector potential of anti-core immune response in BALB/c mice visualized as the capacity to reduce bioluminescent signal emitted from the areas of co-delivery of HCV core variant and luciferase reporter encoding DNA. Composite image of representative mice receiving injections of plasmid encoding one of the HCV core gene variants mixed with plasmid encoding firefly luciferase (Luc; pVaxluc), showing bioluminescence from the injection areas to the left and to the right of the back, on days 4, 9, 15, and 21 post immunization. (a); Average luminescence from all injection sites in a group normalized to the level reached in this group by day 4 post immunization, in % ± SD (b); Correlations of IFN-γ and dual IFN-γ/Il-2 response to HCV core aa 1–56 with the loss of luminescence (Spearman rank test; p < 0.05) (C). Mice were immunized by intradermal injection of plasmids carrying viral (HCV 1b 274933RU) sequences for HCV Core aa 1–60 (60v), 1–98 (98v), 1–152 (152v), 1–173 (173v), 1–191 (191v), and 37–191 (37–191v) controlled by the CMV promoter, and core191v controlled by the EF1-a promoter (191e), or by the CMV-controlled synthetic gene for core aa 1–152 (152s) [50]. Control mice received pVax1. Plasmids were injected intradermally as 1:1 mixture with pVaxLuc. Injections were followed by electroporation. On days 4, 9 to 11, 14 to 15, and 20 and 22 post immunization mice were assessed for the total photon flux emitted from the areas of immunization. Emission was registered by a CCD camera in-built into the Spectrum imager (Perkin Elmer). Bar on the right side shows the color scale reflexing the intensity of photon flux (photons/sec/cm2/sr). Red squires on one of the mouse images depict a typical area with quantification of photon emission. * significant difference from the values exhibited by mice receiving empty vector; ** significant difference from the values exhibited by the control mice receiving empty vector and by the mice receiving core191v (p < 0.05; Mann–Whitney test). Difference in the total photon flux, and % change of the flux between mice receiving viral and synthetic genes for core152 are depicted over the respective bars (Mann–Whitney test).

