Figure 1.
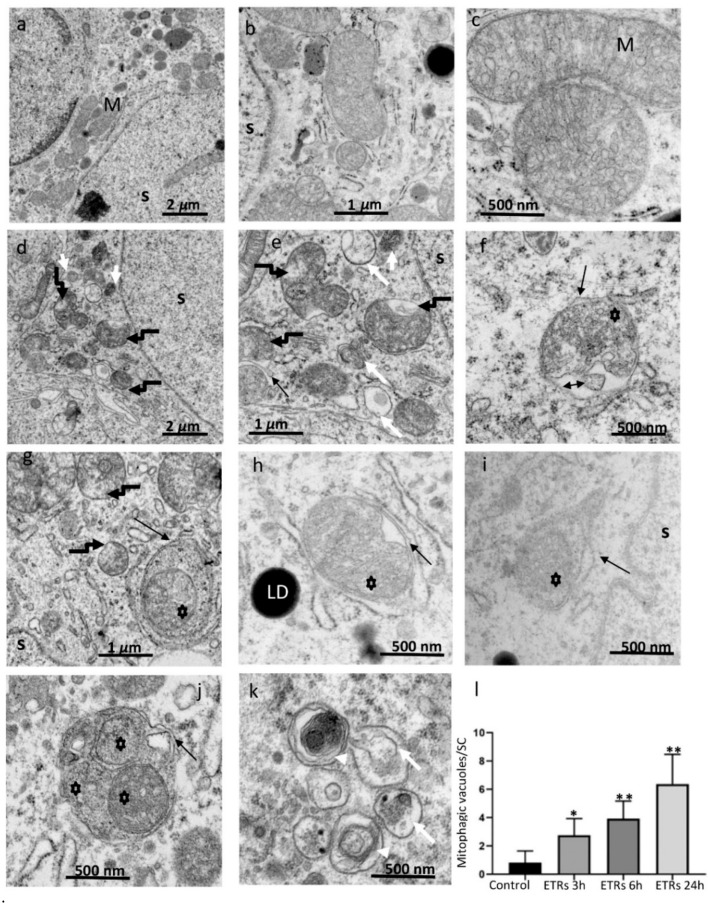
Ultrastructural characteristics of enhanced mitochondrial damage and mitophagy in ethanol-treated rats (ETR) Sertoli cells (SCs.) (a–c): control testes; (d–k): ETRs. Quantification of mitophagy is shown in (l). Note the normal mitochondria (M) in control testes with characteristic vesicular-type cristae. Broken black arrows (d,e,g) indicate damaged mitochondria in ETR SCs, while black arrows show autophagosomal membranes engulfing damaged mitochondria (asterisks) forming mitophagosomes. The double-head arrow indicates damaged fragmented cristae. The long and short white arrows mark autolysosomes and lysosomes, respectively. White arrow heads mark multilamellar bodies. LD: lipid droplets; S: SC nucleus. The histogram depicts quantification of mitophagic vacuoles in the control and ETRs. * p < 0.01 and ** p < 0.001 vs. control (one-way analysis of variance (ANOVA)).

