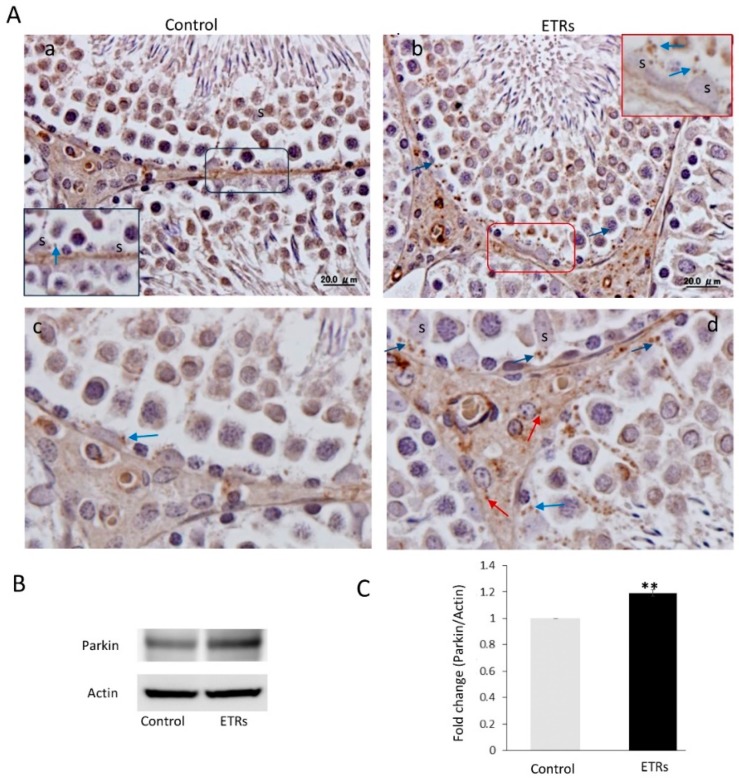
Figure 4.
Ethanol-related increase in Parkin expression in SCs with predominant perinuclear localization (A) IHC of Parkin in the control (a) and ETRs (b). The insets are higher magnifications of the framed areas showing Parkin expression (blue arrows). The lower panels (c,d) are higher magnifications demonstrating Parkin expression in SCs and Leydig cells (red arrows). S: SC nuclei. (B) Western blot of Parkin (n = 3). The histogram in (C) shows a significant increase in Parkin expression in ETRs. ** p < 0.01 (t-test).

