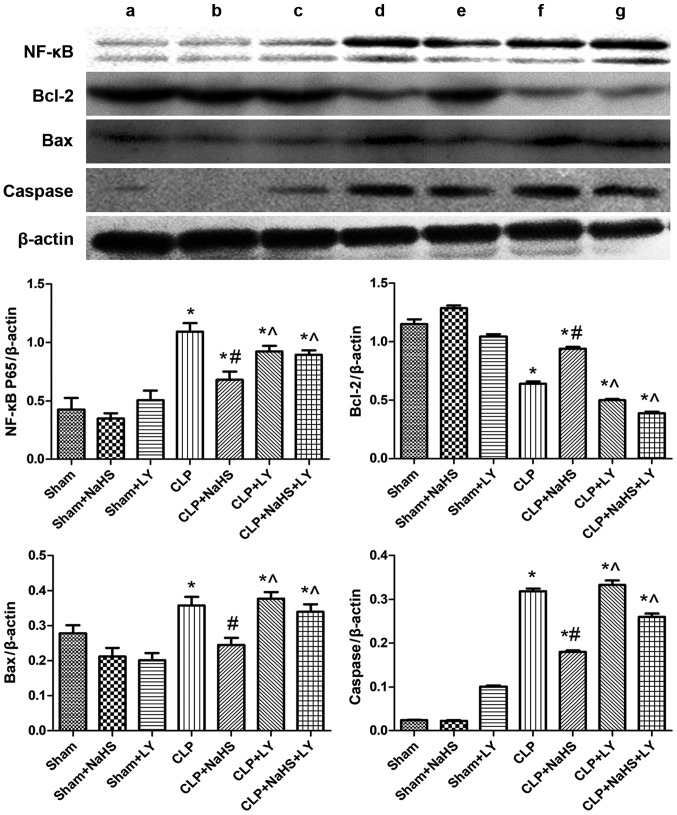
Figure 7.
Expression of NF-κB, Bcl-2, Bax and caspase in each group. Representative western blotting images are presented. Lanes: a, Sham; b, sham + NaHS; c, sham + LY; d, CLP; e, CLP + NaHS; f, CLP + LY; g, CLP + NaHS + LY. Quantified data are expressed as the mean ± standard error. *P<0.05 vs. sham group; #P<0.05 vs. CLP group; ^P<0.05 vs. CLP + NaHS group. NF-κB, nuclear factor-κB; Bcl-2, B-cell lymphoma-2; Bax, Bcl-2-associated X protein; NaHS, sodium hydrosulfide; CLP, cecal ligation and puncture; LY, LY294002.

