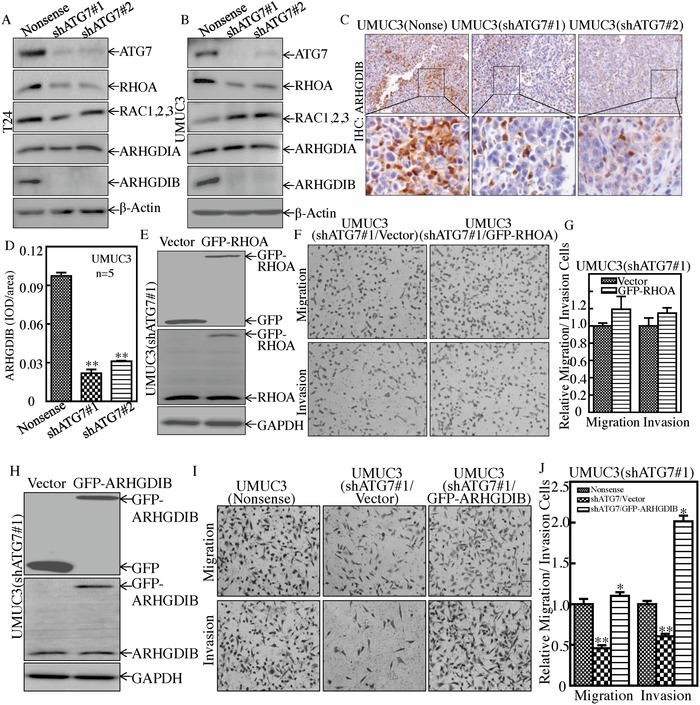
Figure 5.

ARHGDIB, but not RHOA, mediated ATG7 promotion of BC invasion. A,B) Western Blot was used to determine protein expression of ATG7, RHOA, RAC1,2,3, ARHGDIA, and ARHGDIB. β‐Actin was used as a protein loading control. C,D) Athymic nude mice were injected with UMUC3(Nonsense) cells (n = 5), UMUC3(shATG7#1) cells (n = 5), or UMUC3(shATG7#2) cells (n = 5), respectively. IHC staining was performed to evaluate ARHGDIB expression. The IHC images were captured using the AxioVision Rel.4.6 computerized image system and protein expression levels were analyzed by calculating the integrated IOD/area using Image‐Pro Plus version 6.0. Results are presented as the mean ± SD of five mice in each group. Student's t‐test was utilized to determine the p‐value, **p < 0.05. E) GFP‐RHOA expression constructs were stably transfected into UMUC3(shATG7#1) cells, and the stable transfectants were identified by Western Blotting. F,G) The invasion abilities of UMUC3(shATG7#1/Vector) cells and UMUC3(shATG7#1/GFP‐RHOA) cells were determined, as described in the Experimental Section. Results are presented as the mean ± SD from triplicate (p > 0.05). H) GFP‐ARHGDIB expression constructs were stably transfected into UMUC3(shATG7#1) cells and the stable transfectants were identified by Western Blotting. I,J) The invasion abilities of UMUC3(Nonsense), UMUC3(shATG7#1/Vector), and UMUC3(shATG7#1/GFP‐ARHGDIB) cells were determined, as described in the Experimental Section. Bars represent mean ± SD from three independent experiments. Student's t‐test was utilized to determine the p‐value. The double asterisk (**) indicates a significant decrease in comparison to scramble vector transfectants (**p < 0.05), while the asterisk (*) indicates a significant increase in comparison to UMUC3(shATG7#1/Vector) transfectants (*p < 0.05) (J).
