
Figure 3.
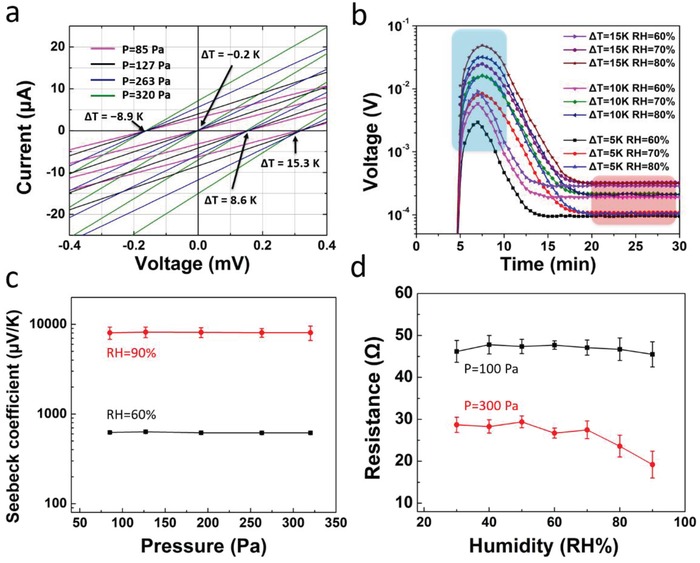
a) Measured I–V curves with different temperatures and pressures. The temperature of one Peltier element was constantly kept at 22 °C while varying the other one. b) Voltage axis intercept of I–V curves (thermal voltage output) as a function of time, under different humidity and temperatures. c) The peak Seebeck coefficient as a function of mechanical pressure, measured under RH = 90% and RH = 60%. d) The resistance of P–T–H sensor as a function of humidity, measured under P = 100 Pa and P = 300 Pa. The error bars are standard deviations obtained from at least five independent measurements.