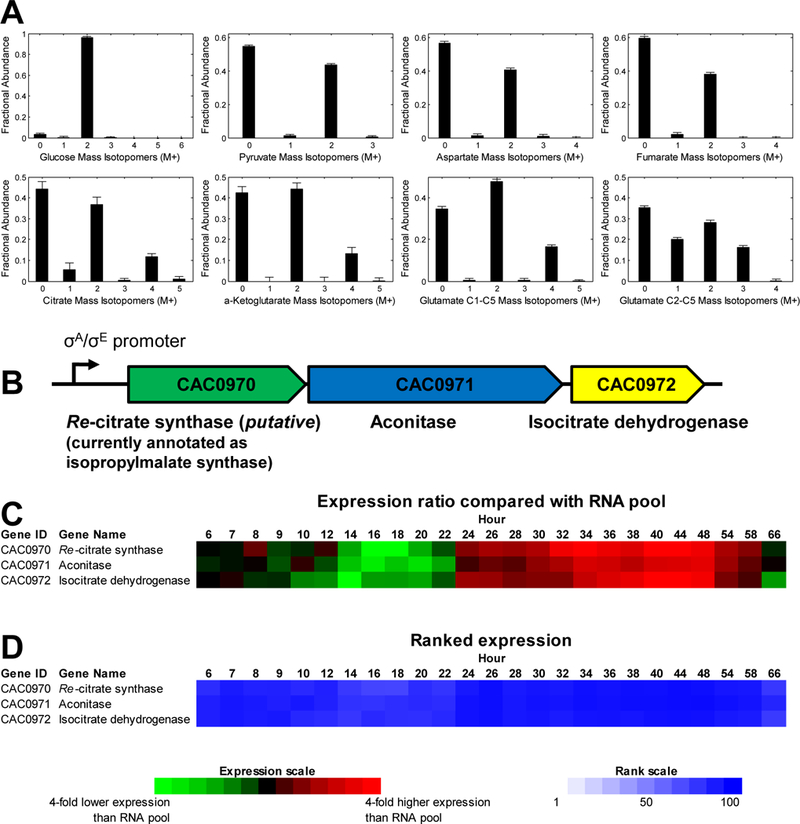
Figure 3. Mass isotopomer distributions of glucose and intracellular metabolites from C. acetobutylicum grown on [1,2-13C2]glucose, and putative Re-citrate synthase in C. acetobutylicum ATCC 824.

(A) MIDs of glucose, pyruvate, aspartate, fumarate, citrate, α-ketoglutarate, and two fragments of glutamate, m/z 432 fragment (C1-C5) and m/z 330 fragment (C2-C5). Data shown were corrected for natural isotope enrichments. (B) Re-citrate synthase is putatively coded by CAC0970 which is part of the tricistronic operon CAC0970–0971-0972. (C) Expression values are presented as ratios compared to a reference mRNA pool [15]. (D) Level of expression as measured by the ranked expression intensity values for each gene. Ranks run from 100 to 1 based on all the expressed genes of the genome at each time point.
