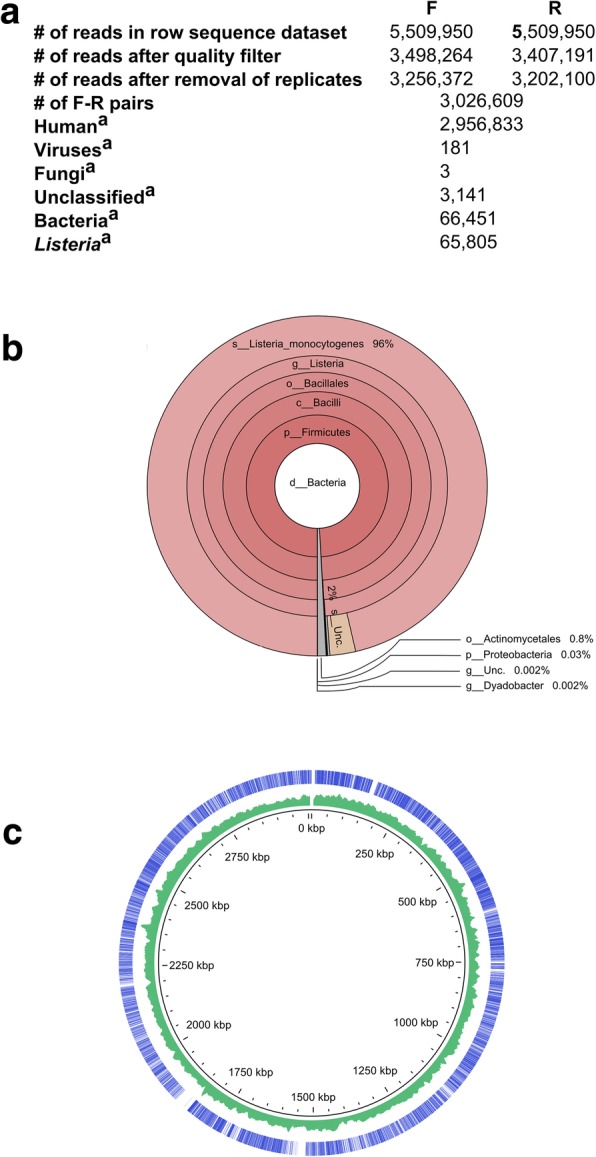
Fig. 2.

Number and taxonomic assignments of sequence reads obtained by WMGS of DNA extracts from the perioaortic tissue sample. F, forwards reads; R, reverse reads. a. Number of sequence reads at different steps of data analysis. b. Krona plots of bacterial taxa identified by Kraken [34]. c. Ring diagram showing the genome of the L. monocytogenes strain 6179 chromosome sequence (GenBank accession number NZ_HG813249). Outer circle depicts the chromosome regions to which mapped pairs of sequence reads indicated by bars. Middle circle shows G + C content expressed as percentage. The inner ring indicates chromosomal position. The figure was generated using GView [17]
