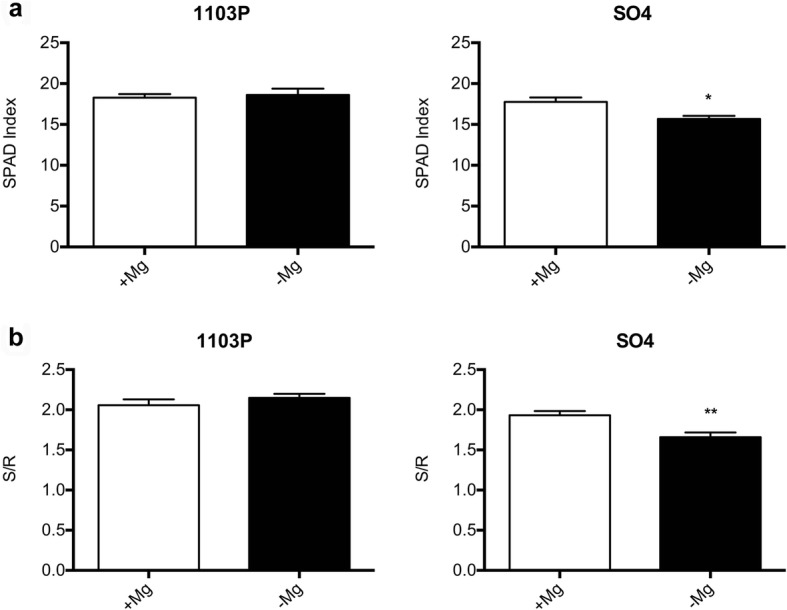
Fig. 2.

Mean SPAD index (a) and S/R (b) values of SO4 and 1103P microcuttings grown for 14 days in presence (+Mg) and absence of Mg (−Mg). Data were expressed as mean ± SEM of data from three growth independent experiments (n = 3). The statistical significance was determined by means of Student’s t-test. (∗P < 0.05) using the GraphPad InStat Program (version 5.0)
