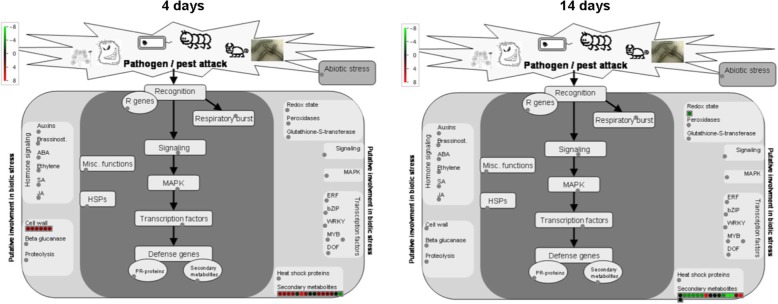
Fig. 6.
Differentially abundant metabolites between 1103P and SO4 linked to stress responses. The Log10(ratio) is shown by the color scale (green indicates a decrease and red an increase in metabolite abundance between 1103P and SO4). The analysis was carried out using MapMan software (https://mapman.gabipd.org/)

