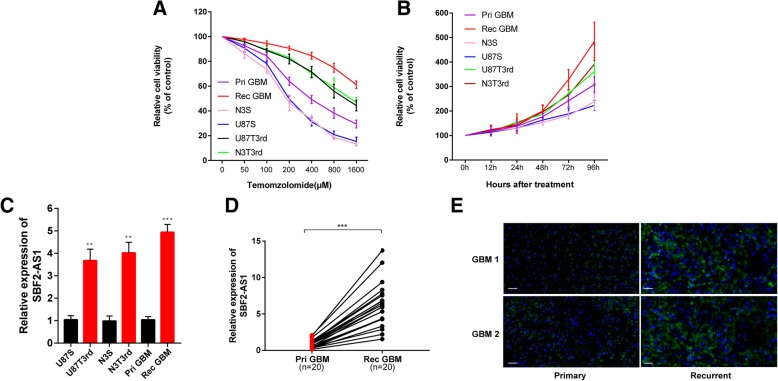
Fig. 1.
LncSBF2-AS1 is upregulated in GBM cell lines and tissues after TMZ treatment. a Cell proliferation of 6 GBM cells was evaluated in response to TMZ at different doses. CCk8 assay was performed after 48 h TMZ treatment. Pri GBM (IC50 = 423.33 μM), N3S (IC50 = 187.73 μM), U87S (IC50 = 197.64 μM), N3T3rd (IC50 = 1321.92 μM), U87T3rd (1143.09 μM). Data are presented as mean ± SEM. b Cell proliferation was eveluated in 6 GBM cells in 200 μM TMZ treatments using CCK8 assay. Data are presented as mean ± SEM. c Expression of LncSBF2-AS1 analyzed by qRT-PCR in TMZ resistant cells and TMZ sensitive cells. The data represents the mean ± SEM from three independent experiments. **P < 0.01, ***P < 0.001 (d) Analysis of LncSBF2-AS1 expression by qRT-PCR in 20 primary GBM tissues and 20 recurrent GBM tissues. Data represents means of three independent experiments ± SEM. ***P < 0.001 (e) FISH analysis of LncSBF2-AS1 expression in recurrent tumor tissues compared to primary tumor tissues. Scale bar, 50 μm

