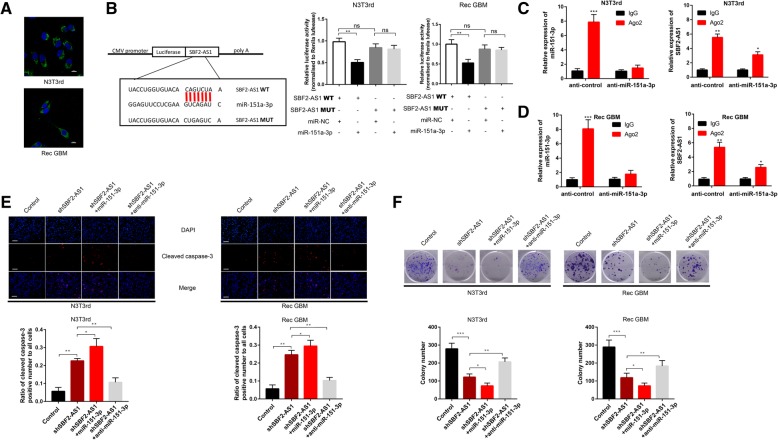
Fig. 5.
Regulatory relationship between lncSBF2-AS1 and miR-151a-3p (a) FISH analysis of the location of lncSBF2-AS1 in the cytoplasm (green) and nucleus (blue) of N3T3rd and Rec GBM cells. b Left: Schematic representation of the miR-151a-3p binding sites in lncRNA SBF2-AS1 and the site mutagenesis. Right: The luciferase reporter plasmid carrying wild type (WT) or mutant (MUT) lncSBF2-AS1 was co-transfected into N3T3rd and Rec GBM cells with miR-151a-3p in parallel with an empty vector. Relative luciferase activity in N3T3rd and Rec GBM cells were determined. Data represents means of three independent experiments ± SEM. **P < 0.01. c and d. RIP assay was established with normal mouse IgG or anti-Ago2 in N3T3rd or Rec GBM cells. Relative expression of SBF2-AS1 and miR-151a-3p were determined by qRT-PCR. Data represents means of three independent experiments ± SEM. **P < 0.01, ***P < 0.001. e. Immunofluorescent staining of cleaved caspase-3 in N3T3rd and Rec GBM cells transfected with SBF2-AS1 plasmid, miR-151a-3p mimics + SBF2-AS1 plasmid or miR-151a-3p inhibitor + SBF2-AS1 plasmid after 200 μM TMZ treatment for 48 h. Data represents means of three independent experiments ± SEM. **P < 0.01. Scale bar, 50 μm. f Colony formation ability of N3T3rd and Rec GBM cells transfected with SBF2-AS1 plasmid, miR-151a-3p mimics + SBF2-AS1 plasmid or miR-151a-3p inhibitor + SBF2-AS1 plasmid after 200 μM TMZ treatment for 48 h. Data represents means of three independent experiments ± SEM. *P < 0.05, **P < 0.01. Flow cytometry of N3T3rd and Rec GBM cells transfected with SBF2-AS1 plasmid, miR-151a-3p mimics + SBF2-AS1 plasmid or miR-151a-3p inhibitor + SBF2-AS1 plasmid after 200 μM TMZ treatment for 48 h. Data represents means of three independent experiments ± SEM. *P < 0.05, **P < 0.01

