Fig. 2.

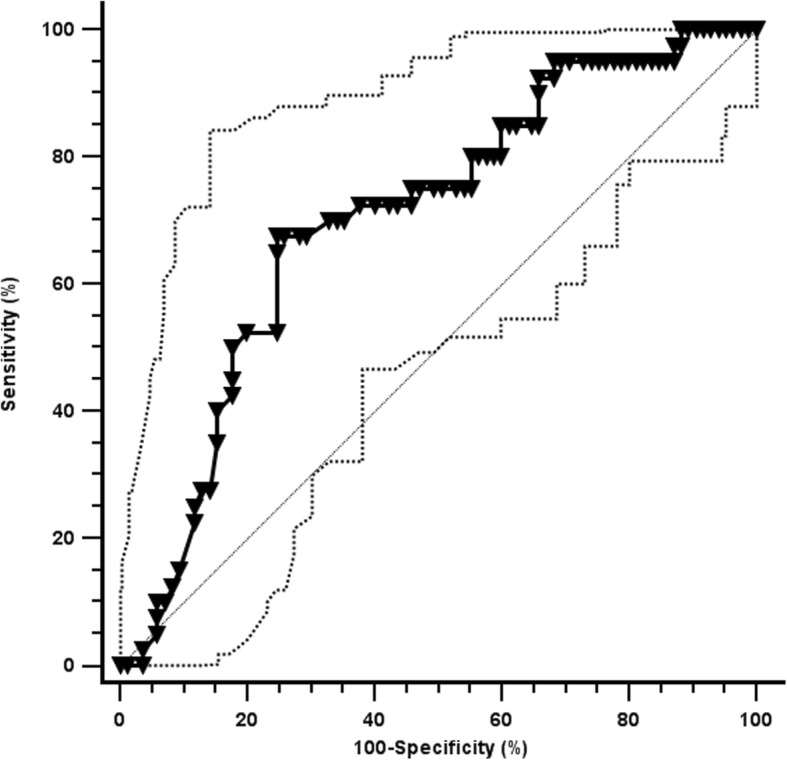
Receiver Operator Characteristic curve for the prediction of CPAP failure. Black and hatched lines represent the area under the curve (AUC) and its 95% confidence interval. Diagonal line represents an AUC of 0.5. More details in the text

Receiver Operator Characteristic curve for the prediction of CPAP failure. Black and hatched lines represent the area under the curve (AUC) and its 95% confidence interval. Diagonal line represents an AUC of 0.5. More details in the text