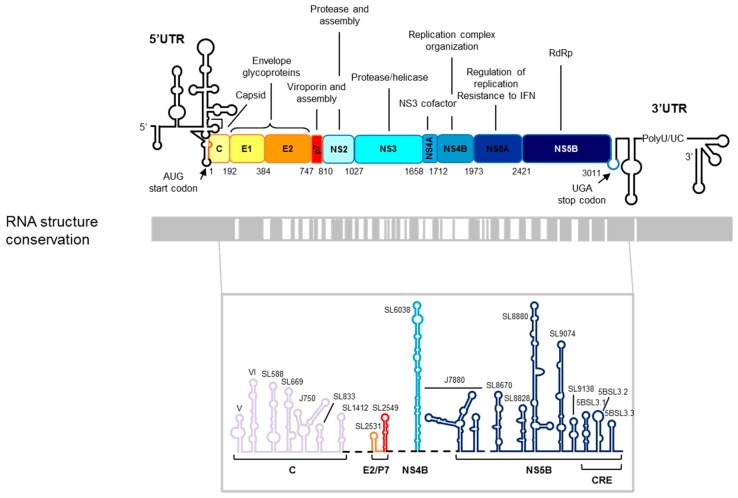
Figure 1.
The hepatitis C virus (HCV) RNA genome. Upper panel: A schematic representation of the genetic organization of the viral genome. The 5′ and 3′ UTRs flanking the single ORF are depicted by a black line. The viral proteins and their functions are indicated. The translational start and stop codons are marked by arrows. The numbering corresponds to the codon positions in the ORF according to the HCV Con1 isolate, genotype 1b. Lower panel: A structural conservation map of the HCV RNA is represented by gray boxes denoting structurally conserved regions among different viral isolates. The predicted secondary structures of conserved elements in the ORF of the viral RNA genome are shown at the bottom. The color code and labels at the bottom indicate the position where each stem-loop is located. The figure is adapted from Reference [27].

