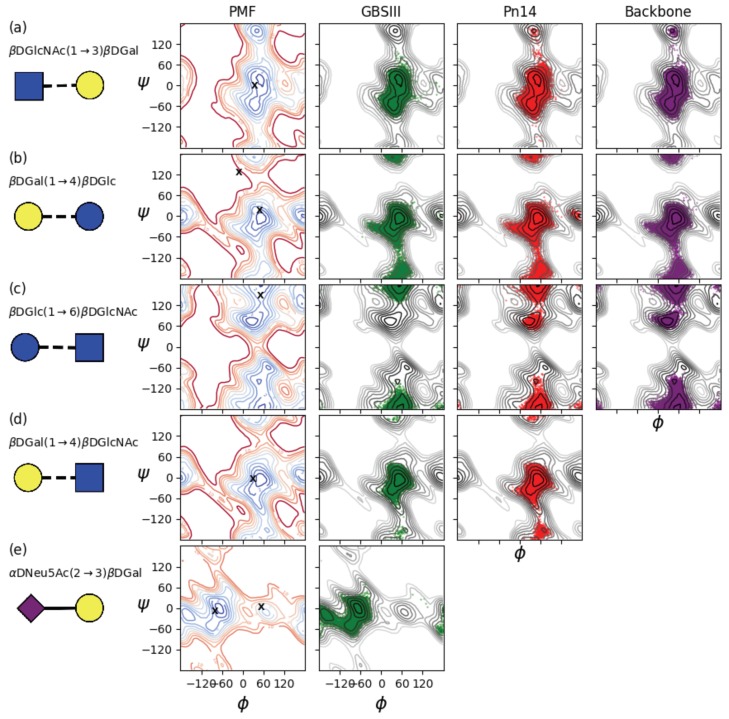
Figure A1.
The left column shows contoured disaccharide , PMF surfaces for (a) dGlcNAc(1→3)dGal, (b) dGal(1→4)dGlc, (c) dGlc(1→6)dGlcNAc, (d) dGal(1→4)dGlcNAc and (e) dNeu5Ac(2→3)dGal. The PMF for the charged dNeu5Ac(2→3)dGal disaccharide is in solution, all others are gas-phase. Contours are drawn at intervals of 1 kcal·mol to a maximum of 12 kcal·mol and ‘X’ markers indicate dihedral angle values from the six-sugar GBSIII epitope in complex with Fab crystal structure [13]. Scatter plots of the corresponding two central linkages in the 6RU oligosaccharide strands for the last 900 ns of simulation time are superimposed on the PMFs for 6RU of GBSIII (column 2, green), Pn14 (column 3, red) and the unbranched backbone (right column, purple).

