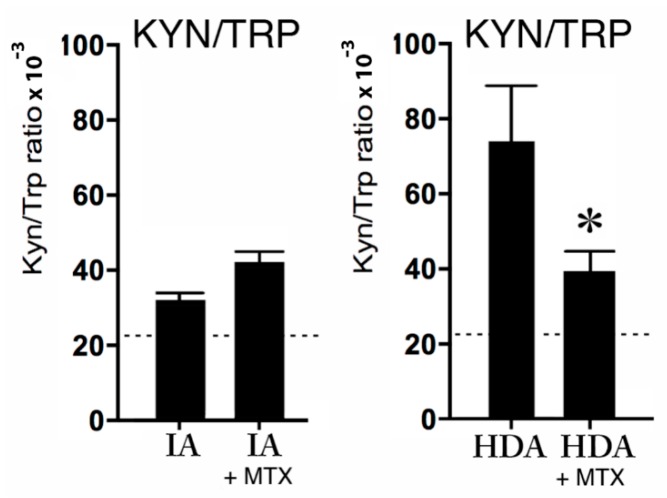
Figure 4.
The KYN/TRP ratio × 10−3 in clinically inactive patients (IA) without (n = 6) or with MTX treatment (n = 6), and the KYN/TRP ratio × 10−3 during high disease activity (HDA) (n = 6) without or with MTX treatment (n = 6). The dotted lines are the reference values in healthy children from previous studies [24,25,26]. Data are presented as means ± SEM. Significance is described as * p < 0.05.

