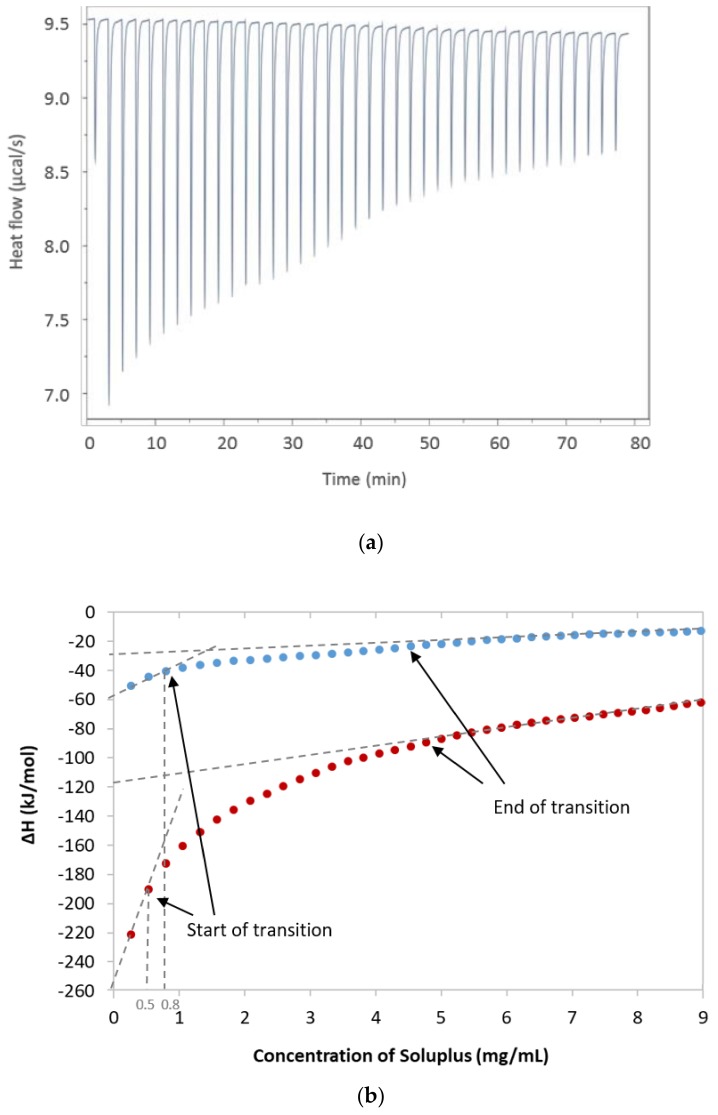
Figure 2.
Data obtained from the isothermal titration calorimetry (ITC) analysis. (a) Exothermic heat flow upon injections of Soluplus® into water at 25 °C, (b) Integrated heat data with indicated start and end of transition (i.e., micellisation of Soluplus® at 25 °C); the blue dots are only Soluplus® and the red dots are with furosemide added to the system. The dotted lines indicate on the x-axis the critical micelle concentration (CMC; concentration at the start of transition); the intercept with the y-axis was used to estimate ΔHmic (ΔHend of transition − ΔHstart of transition).

